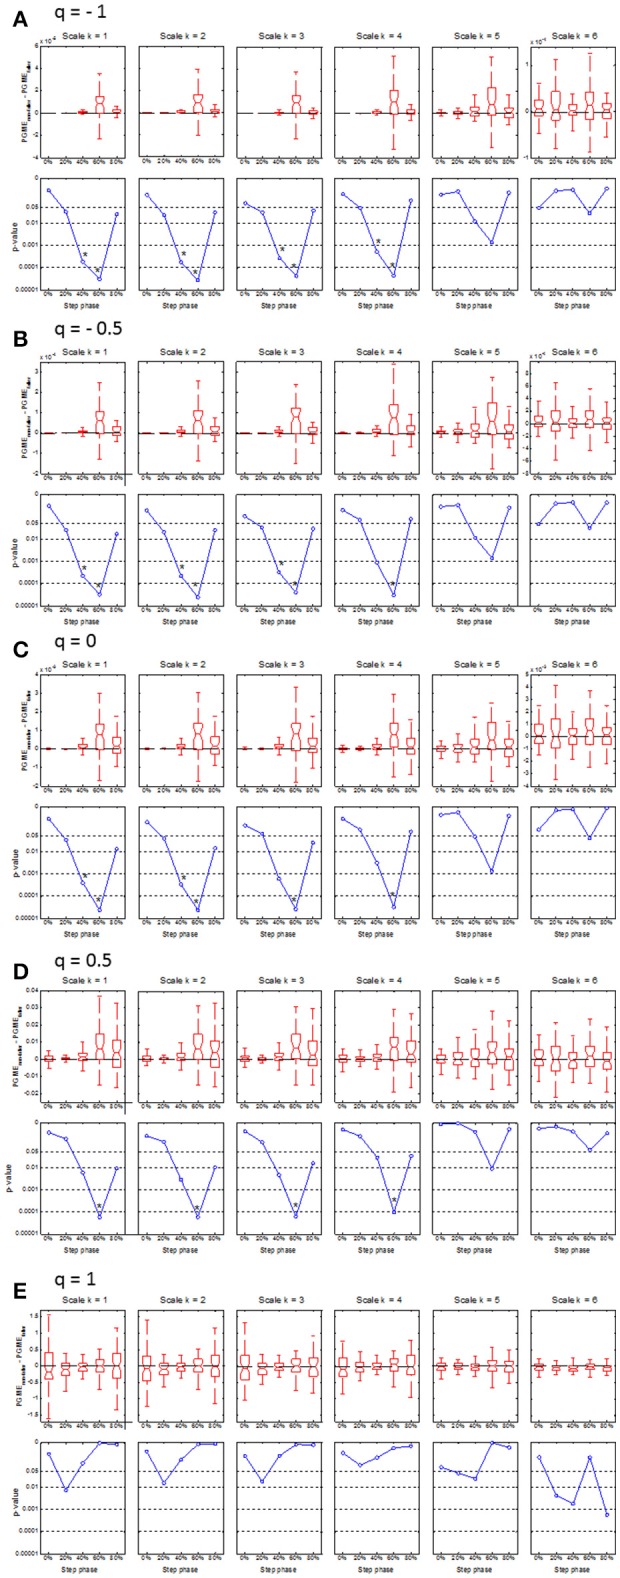
Figure 3.

Boxplots (upper row) and corresponding p-values (lower row) of the median difference between PGME of single-time fallers and their matched non-falling controls. The x-axis of each plot indicates how the median difference or corresponding p-values changes with the step phase. The upper and lower panels on each row (A–E) indicates how the median difference and the corresponding p-values change with the scale k = 1 to 6. Rows (A–E) of the panels indicate how the median difference in PGME and corresponding p-values change according to q-orders, q = −1, −0.5, 0, 0.5 and 1, of the PGME. Note that the center of the boxes represents the group median and the upper and lower borders of the box represent the 75th and 25th percentile, respectively. The whiskers represent the most deviating values within 1.5 times the interquartile range from the median value and the notches represent the confidence interval of the median value.
