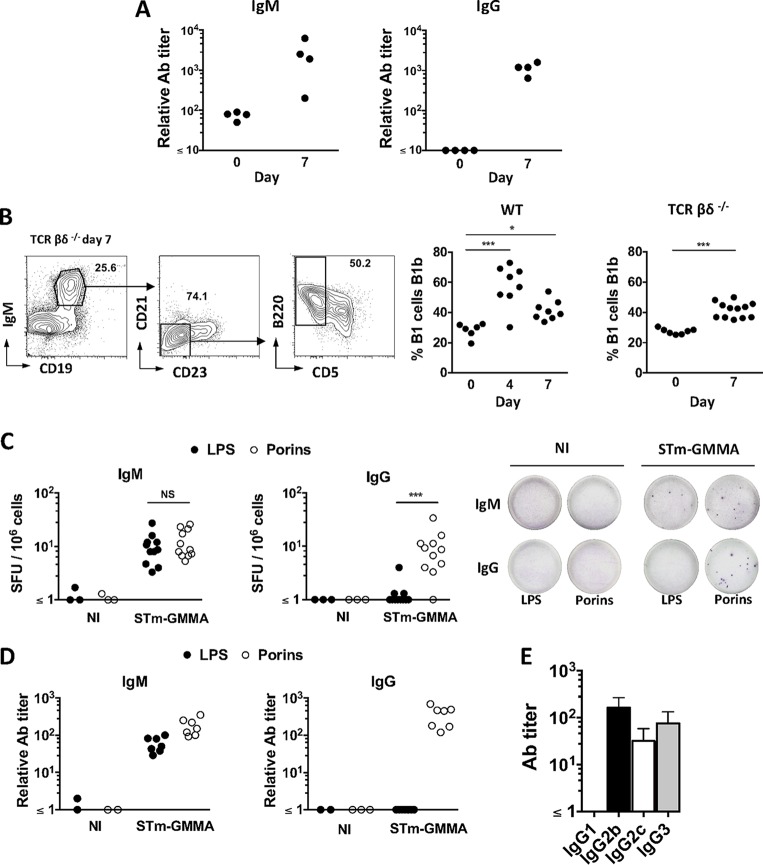
FIG 4 .
STmGMMA induce an early T-cell-independent anti-porin IgG response that is associated with B1b cells. (A) T-cell-deficient (TCRβδ−/−) mice were immunized i.p. with 1 μg of STmGMMA for 7 days, and serum samples were analyzed by ELISA for anti-STmGMMA IgM (left) and IgG (right). Each dot represents one serum sample. (B) WT or TCRβδ−/− mice were immunized with 1 μg of STmGMMA for the times stated, and representative FACS gating for B1b cells from peritoneal cavity flushes is shown. B1 cells were identified as IgM+ CD19+ CD21lo CD23lo, and B1b cells were identified as B1 cells that were CD5− B220+ (representative FACS plots to demonstrate gating are from TCRβδ−/− mice immunized for 7 days). Frequencies of B1b cells in B1 cells of WT (left) and TCRβδ−/− (right) mice at the postimmunization time points indicated are shown in the graphs. Each dot represents one mouse, and pooled results of two experiments are shown. (C) IgM+ (left) and IgG+ (right) ASC against LPS (closed circles) or porins (open circles) in the spleens of TCRβδ−/− mice immunized with STmGMMA for 7 days identified by B-cell ELISPOT assay. Numbers of spot-forming units (SFU) per million splenocytes are depicted in the graphs alongside representative pictures of wells after development. Each dot represents one mouse, and pooled results of multiple experiments are shown. (D) TCRβδ−/− mice were immunized with STmGMMA for 7 days, and titers of IgM (left) and IgG (right) against LPS (closed circles) or porins (open circles) in serum samples were analyzed by ELISA. Each dot represents one serum sample, and the results are representative of two independent experiments. (E) TCRβδ−/− mice were immunized with STmGMMA for 7 days, and IgG isotypes against porins in serum samples were analyzed by ELISA. Graphs show the mean values and standard deviations of groups of four mice. NI, nonimmunized. Statistical analysis was performed with the Kruskal-Wallis test and Dunn’s multiple-comparison test, with time zero as the reference time point for the left graph in panel B, and the Mann-Whitney U test was used for the right graph in panel B and for panel C. NS, nonsignificant; **, P ≤ 0.01; ***, P ≤ 0.001.

