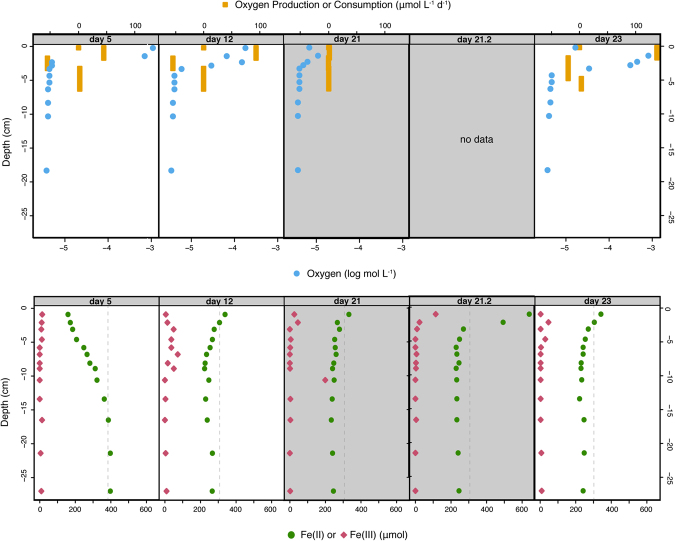
Figure 2.
Results from the 4-week incubation of Synechococcus PCC 7002 in the column. Top panels show measured oxygen (blue circles) and the modeled oxygen consumption (negative) and production (positive) rates (yellow squares). Bottom panels show Fe(II) and Fe(III) concentrations measured in aqueous samples taken from the column. Dashed lines are Fe(II) concentrations of the medium reservoir. The column was incubated in the light for 20 days, then in dark on days 20 to 22 (gray panels), then in the light again for the remainder of the experiment.

