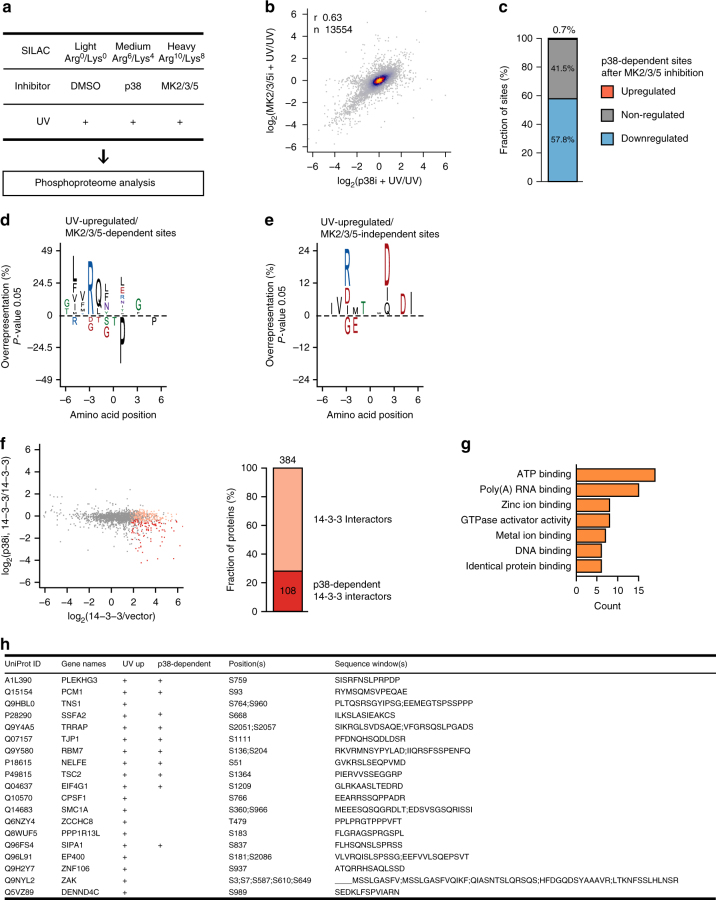
Fig. 2.
MK2/3 are key transducers of p38 signaling after UV light. a Schematic representation of the strategy used to identify UV-light-induced, MK2/3/5-dependent phosphorylation sites. SILAC-labeled U2OS cells were mock-treated (Light), pretreated with the p38 inhibitor (Medium) or the MK2/3/5 inhibitor (Heavy), and subsequently irradiated with UV light (40 J/m2, 1 h recovery). The phosphoproteome analysis was performed as described in Fig. 1c. b The scatter plot shows the logarithmized SILAC ratios of quantified phosphorylation sites. The color-coding indicates the density. A majority of UV-light-induced, p38-dependent phosphorylation sites significantly decreased in abundance also after MK2/3/5 inhibition, whereas a smaller fraction of sites decreased in abundance only after p38 inhibition. c The bar graph shows the percentage of UV-light-upregulated, p38-dependent sites that are up-, non-, or downregulated after MK2/3/5 inhibition. Nearly 60% of p38-dependent phosphorylation sites are also dependent on MK2/3/5. d Sequence motif analysis of p38- and MK2/3/5-dependent phosphorylation sites. The analysis was done as described in Fig. 1e. The sequence surrounding the phosphorylated residue shows an enrichment of glutamine (Q) in position – 2, arginine (R) in – 3, and leucine (L) in – 5. e Sequence motif analysis of p38-dependent, MK2/3/5-independent sites phosphorylation sites. The analysis was done as described in Fig. 1e. The sequence surrounding the phosphorylated residue shows an enrichment of aspartic acid (D) in position + 2, + 4, and arginine (R) in – 3. f The scatter plot shows the logarithmized SILAC ratios of quantified proteins. 14-3-3 interaction partners and p38-dependent interactions are indicated in light and dark red, respectively. Three hundred and eighty-four proteins were significantly enriched in 14-3-3 pull downs after UV light (p-value < 0.05, moderated t-test). One hundred and eight out of 384 proteins (28%) bound to 14-3-3 in a p38-dependent manner. g The bar plot shows the number of proteins with the indicated Gene Ontology (GO)-molecular function terms that were enriched among p38-dependent 14-3-3 interaction partners. h The table shows selected RNA-binding proteins that were identified as p38-dependent interaction partners of 14-3-3. The UniProt ID, protein name, gene name, position(s), and sequence window of UV-light-induced phosphorylation sites identified in phosphoproteomics screen is indicated

