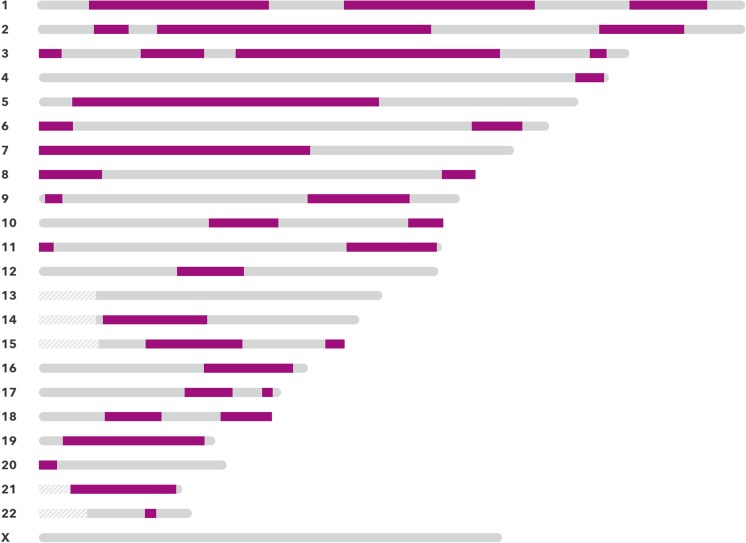
Fig. 1.
At-home DNA relationship testing result. Ancestry test result depicts chromosomes, shown by gray bars, and ordered according to autosomal number. The green regions represent segments of contiguous SNPs that are shared between the proband and child. In a typical parent/child relationship, the green regions would have longer contiguous green lines across the length of chromosomal segments, rather than short green lines that represent the ~ 25% of shared DNA, as is seen in this uncle/nephew biological relationship

