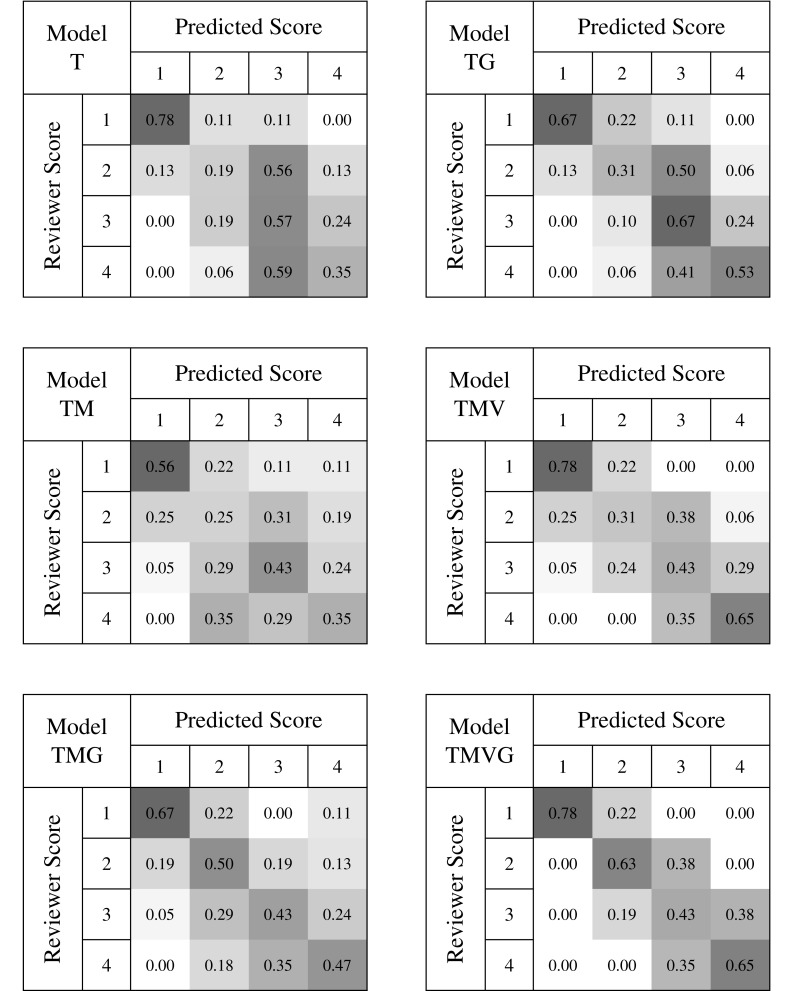
Fig. 9.

Confusion matrices for the six models generated from motion data. The abbreviations indicate which features are included in each model: T time, G grip angle, M tip motion, and V tool visibility. Each cell represents the number of testing trials predicted to have the score in the column divided by the total number of trials given the score in that row by the reviewer. The color intensity of each cell is proportional to the value of the cell on a scale from 0 to 1
