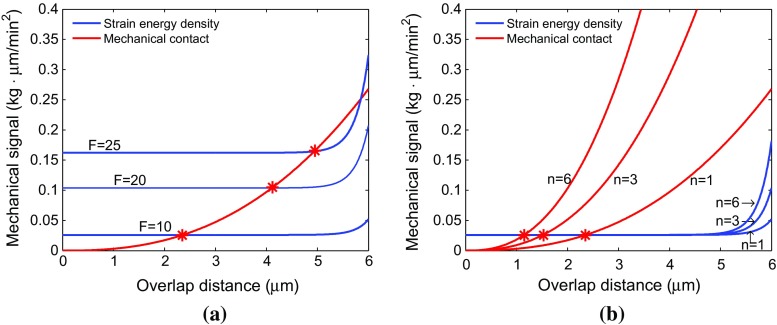
Fig. 2.
Red and blue lines represent mechanical contact force and strain energy density, respectively. a Compares the strain energy density with different cell traction force F values. b Compares the mechanical contact force and strain energy density of one cell when it is surrounded by other one, three and six cells, respectively, for F = 10 kg m/min

