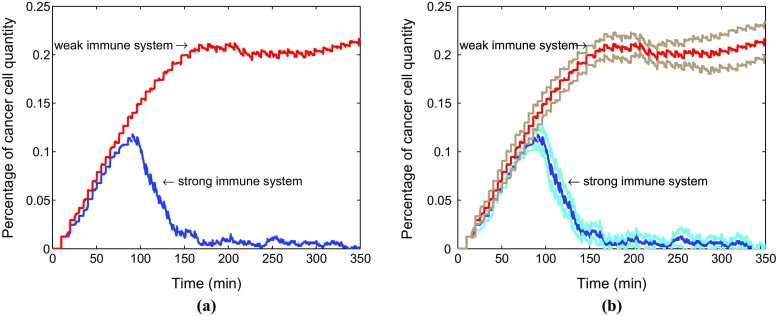
Fig. 5.
Comparison for change of the percentage of cancer cells in total cells in two situations. The red and blue lines represent the evolution of the percentage of cancer cells in a weak immune system and a strong immune system, respectively (a). Furthermore, the corresponding confidence intervals are shown in b. The brown and light blue lines denote the confidence intervals of a weak immune system as well as a strong immune system in the tumor islets without anisotropic collagen orientation (), respectively

