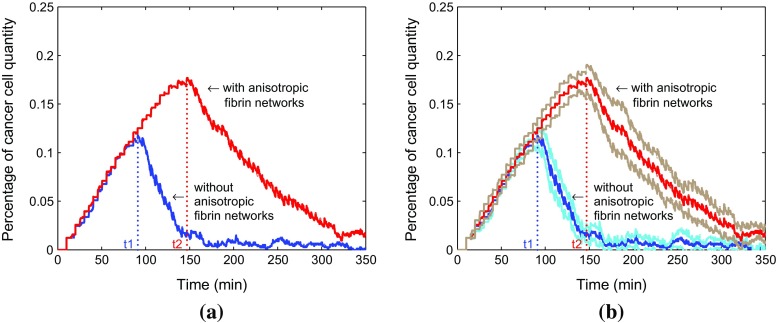
Fig. 9.
a Comparison for time to fight the cancer cells. The blue and red lines represent the strong immune system without anisotropic collagen orientation (with the response time ) and with anisotropic collagen orientation (with the response time ), respectively. Furthermore, the corresponding confidence intervals are shown in b. The light blue and brown lines denote the confidence intervals of strong immune systems in the tumor islets without anisotropic collagen orientation () as well as with anisotropic collagen orientation (), respectively

