
Fig. 3.
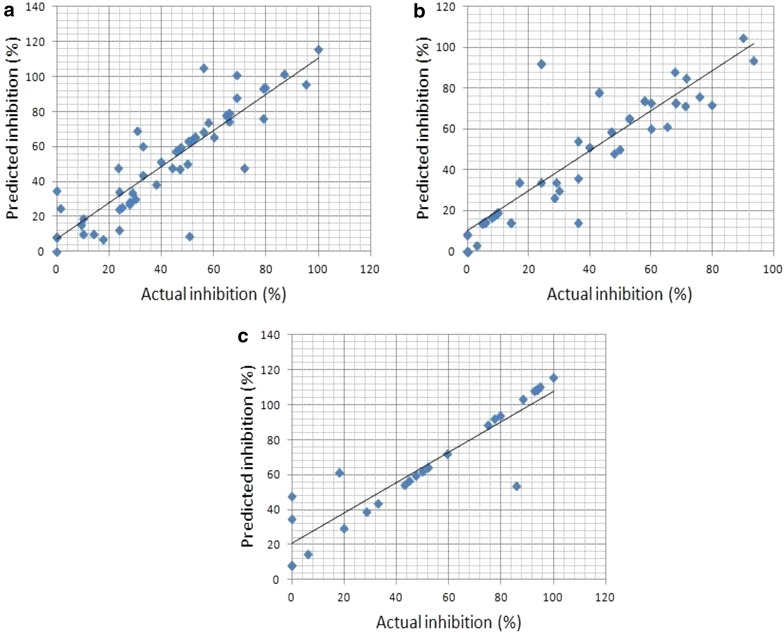
Scatter plot of predicted and actual percentage inhibition on independent validation datasets of a reverse transcriptase (RT), b protease (PR) and c integrase (IN)
Official websites use .gov
A
.gov website belongs to an official
government organization in the United States.
Secure .gov websites use HTTPS
A lock (
) or https:// means you've safely
connected to the .gov website. Share sensitive
information only on official, secure websites.
Scatter plot of predicted and actual percentage inhibition on independent validation datasets of a reverse transcriptase (RT), b protease (PR) and c integrase (IN)