
Fig. 6.
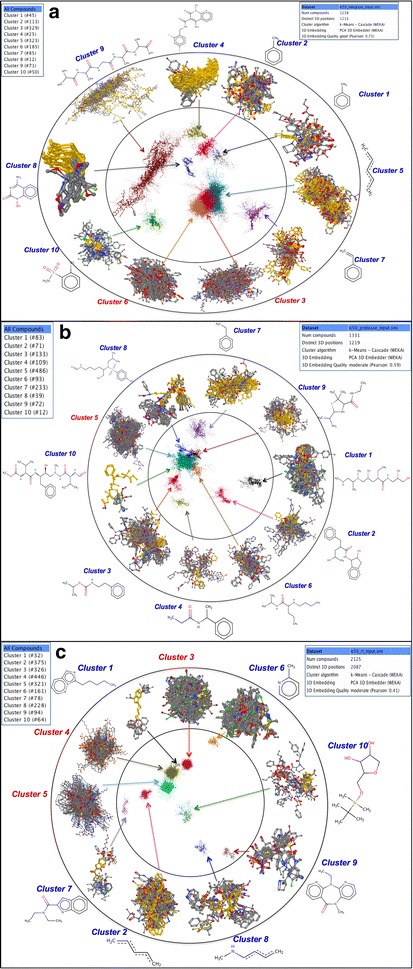
Chemical space mapping outline of a reverse transcriptase (RT), b protease (PR) and c integrase (IN) inhibitors (IC50) with internal circle showing clustering and 3-D embedding of compounds, middle circle with exact (zoomed) superimposed cluster and outermost circle with specific MCS of each cluster