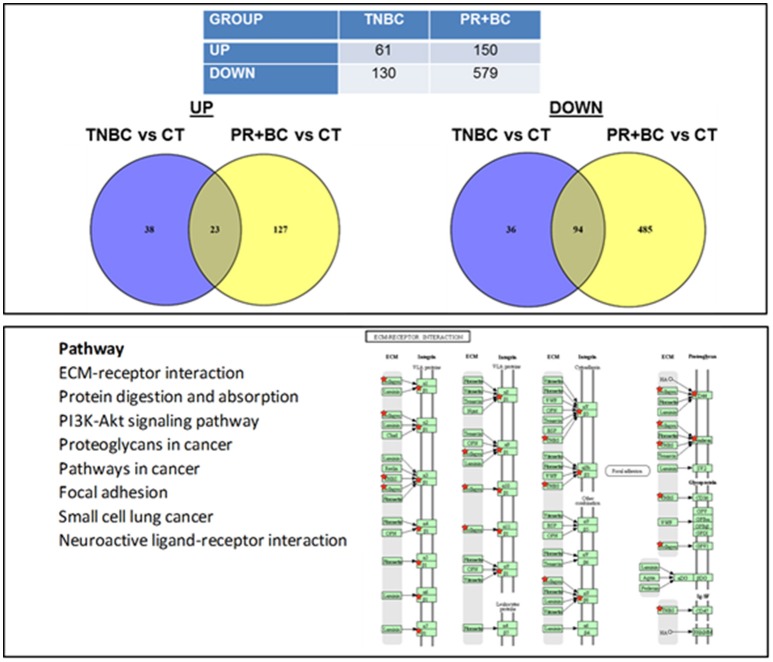
Figure 2.
Next generation sequencing-based analysis of gene expression in the hippocampal tissues of control and TNBC and PR+BC TumorGraft mice. Table and Venn diagrams show numbers of genes that were significantly different between TNBC and PR+BC mice, as compared to controls. Below is a list of molecular pathways that were commonly down-regulated in the hippocampal tissues of TNBC and PR+BC mice. Pathview/KEGG analysis was used to determine differentially affected pathways. Figure displays the KEGG ECM-Receptor Interaction pathway.

