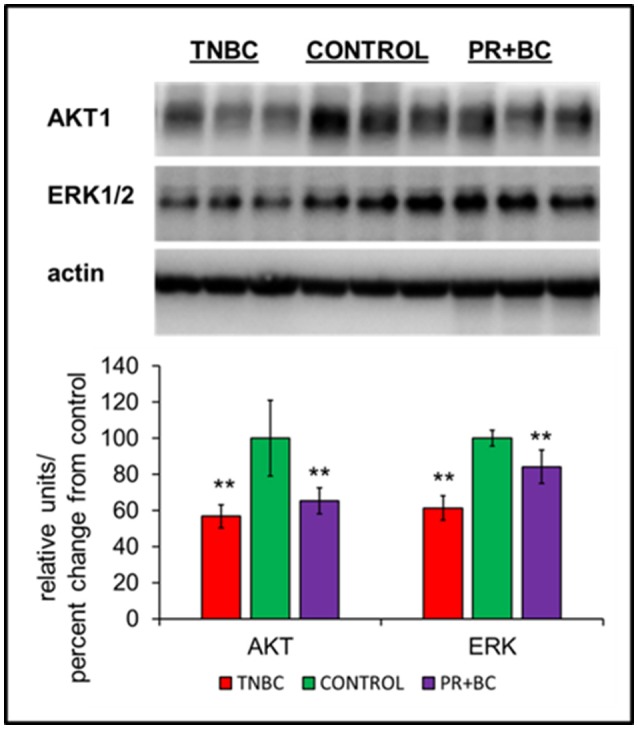
Figure 3.

Levels of AKT1 and ERK1/2 in the hippocampal tissues of control and TNBC and PR+BC TumorGraft mice. Data are shown as relative units/percent change from control. Due to protein size differences and scarcity of tissue, membranes were re-used several times. **p < 0.01.
