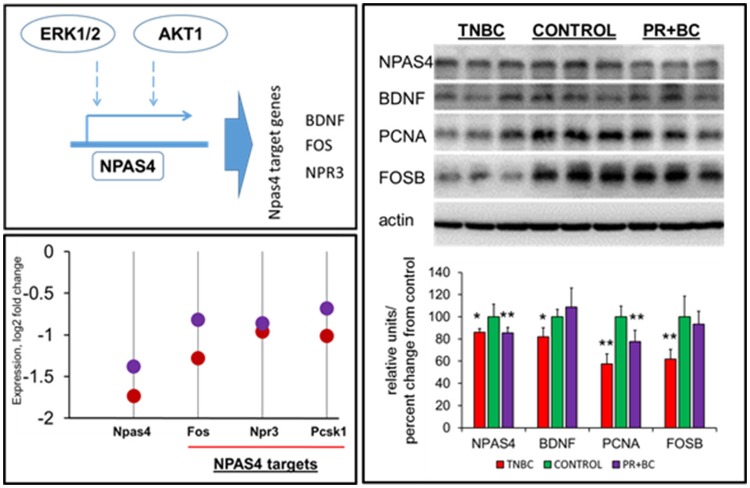
Figure 5.
Levels of NPAS4, NPAS4 targets and PCNA in the hippocampal tissues of control and TNBC and PR+BC TumorGraft mice. Schematic representation of the control of NPAS4 protein by AKT1 and ERK1/2 pathways. Expression levels of Npas4 gene and its target genes 9Fos, Npr3, and Pcsk1 in TNBC (red) and PR+BC (purple) animals are given in log2 fold change, as compared to controls. Western immunoblotting was performed to deternime the levels of NPAS4, BDNF, FOSB, and PCNA. The graph represents Western immunoblotting results. Data are shown as relative units/percent change from control. Due to protein size differences and scarcity of tissue, membranes were re-used several times. *p < 0.05; **p < 0.01.

