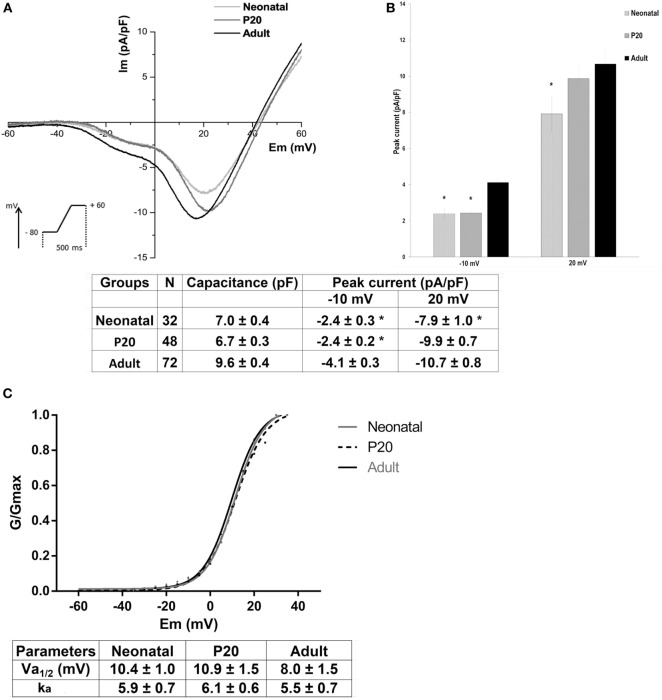
Figure 2.
Biophysical properties of low-voltage-activated (LVA) and high-voltage-activated (HVA) calcium currents in neonatal, P20, and adult beta cells. (A) Ca2+ current density (Im, pA/pF) and voltage relationship (IV) of neonatal (black line, n = 32), P20 (red line, n = 48), and adult cells (blue line, n = 72). Protocol: voltage ramp from −80 to +60 mV, 500 ms duration, and 0.5 mV/ms slope, HP = −80 mV. (B) Quantification of capacitance cell and peak current density at −10 and +20 mV corresponding to LVA and HVA currents, respectively, in neonatal, P20, and adult beta cells. Data are expressed as current density average ± SEM, n denotes the number of cells recorded. (C) Voltage activation curves of HVA channels, which represent the Boltzmann fit to the data obtained from a protocol of depolarizing test pulses from −60 to +40 with 5 mV increments (top panel) and comparison of Boltzmann parameters calculated for plots of Ca2+ conductance in neonatal, P20, and adult beta cells (bottom panel). Data are mean ± SEM of 9 neonatal, 15 P20, and 9 adult cells. *p ≤ 0.05 denotes significant differences with respect to adult cells, Tukey test (analysis of variance).

