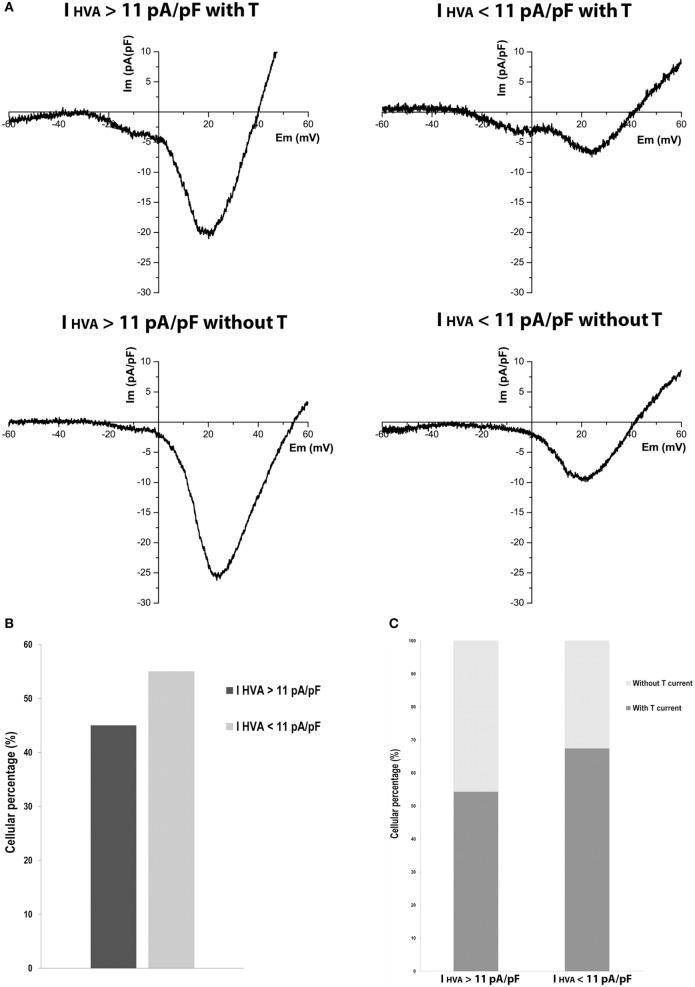
Figure 3.
Variability of high-voltage-activated (HVA) calcium currents in P20 beta cells. (A) Representative recordings of global calcium currents observed in P20 beta cells with HVA currents higher or less than HVA currents of adult beta cells with or without T-type current. Protocol: voltage ramp from −80 to +60 mV, 500 ms duration, and 0.5 mV/ms slope. (B) Quantification of the P20 beta cells percentage with HVA currents higher (n = 35) and less (n = 43) than HVA currents of adult beta cells. (C) Quantification of the P20 beta cells percentage represented in (B) with and without T-type calcium current.

