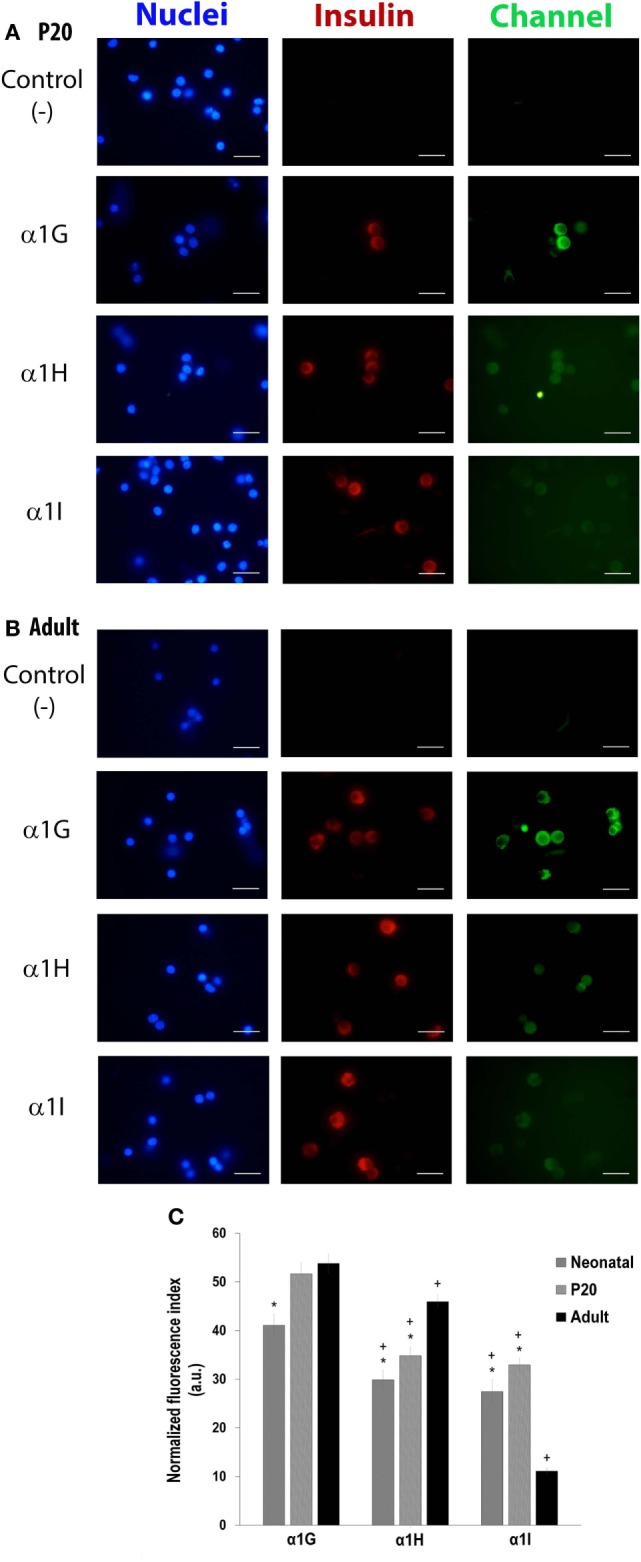
Figure 4.

Differential expression of T-type channels (α1G, α1H, and α1I subunits) in neonatal, P20, and adult pancreatic beta cells. Representative fluorescence micrographs of expression of α1G, α1H, and α1I subunits of P20 (A) and adult (B) cells in culture, showing differences in the levels of immunostaining. Scale bars represent 20 µm. (C) Immunofluorescence index measured from about 150–200 cells per isoform per age. Symbols denote significant differences with respect to adult cells (*) and with respect to the α1G subunit in each age (+), p ≤ 0.05, Dunnet test (analysis of variance).
