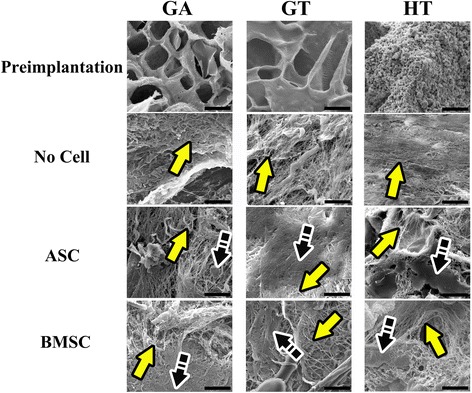
Fig. 8.

Scanning electron photomicrographs of scaffolds before cell loading (preimplantation) and 9 weeks after implantation without (no cell) or combined with equine ASCs or BMSCs. Magnification = 3000×; scale bar = 20 μm. Yellow arrows show collagen fibrils; black arrows show solid (mineralizing) region. ASC adipose-derived multipotent stromal cell, BMSC bone marrow-derived multipotent stromal cell, GA polyethylene glycol (PEG)/poly-l-lactic acid (PLLA), GT PEG/PLLA/tricalcium phosphate (TCP)/hydroxyapatite (HA), HT TCP/HA
