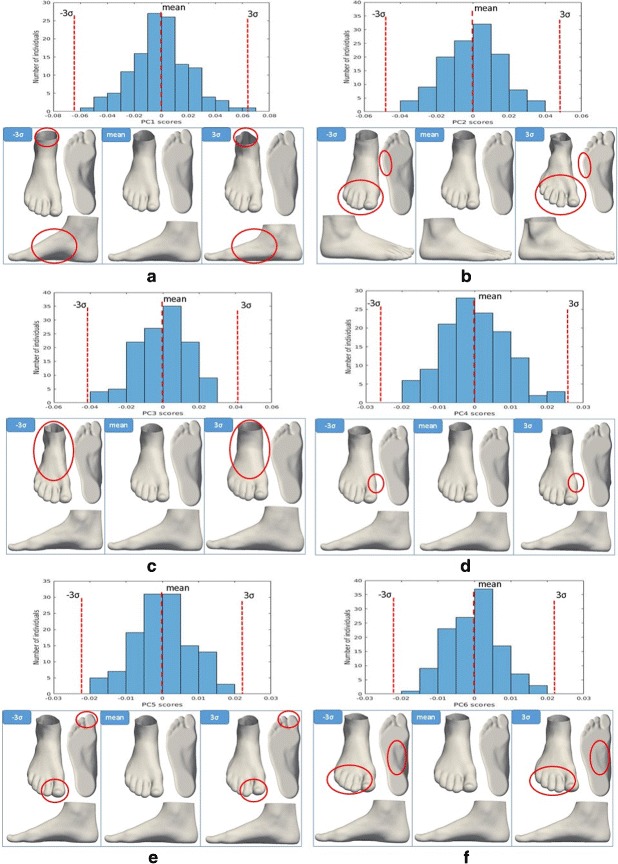
Fig. 3.

Histograms and views of the first six PCs of the 3D foot shape in a healthy population. a The first principal component (visualized by the foot shapes along the PC 1 axis) is a contrast between high arched feet (low PC 1 sores) and flat feet (high PC 1 scores). b The second principal component (visualized by the foot shapes along the PC 2 axis) represents the differences between narrow ball width with touching toes (low PC 2 scores) and wide ball width with spread out toes (high PC 2 scores). c The third principal component (visualized by the foot shapes along the PC 3 axis) is a contrast between narrow feet (low PC 3 sores) and wide feet (high PC 3 scores). d The fourth principal component (visualized by the foot shapes along the PC 4 axis) represents the differences between feet with normal hallux bone (low PC 4 scores) and feet whose hallux bone is angled towards the other toes-hallux valgus (high PC 4 scores). e The fifth principal component (visualized by the foot shapes along the PC 5 axis) is a contrast between “Egyptian” foot type (low PC 5 sores) and “Greek” foot type (high PC 5 scores). f The sixth principal component (visualized by the foot shapes along the PC 6 axis) represents the differences between feet with a narrow midfoot with toes angled laterally (low PC 6 scores) and feet with a wide midfoot with toes angled medially (high PC 6 scores)
