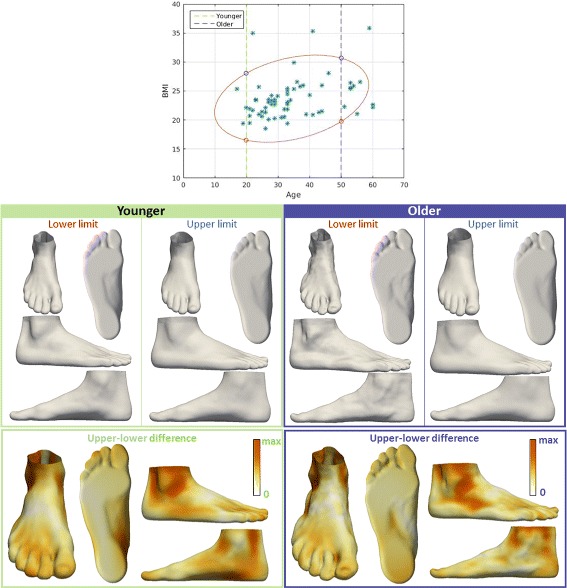
Fig. 4.

Visualization of the effect of BMI on foot shape. The influence of BMI on foot shape of younger people (20 years old, green box), and the influence of BMI on foot shape of older people (50 years old, purple box). Upper and lower limits are determined for each group as intersections with contour that covers the range that 90% of the values fall into. For each group, the influence of BMI is represented by color-mapped Euclidean distance computed between the foot shape obtained for upper limit and the foot shape obtained for lower limit
