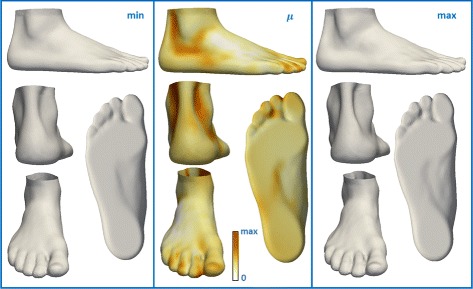
Fig. 8.

Visualization of the effect of frequency of sport activity on foot shape. The influence of frequency of sport activity on foot shape (middle), the expected foot shape for 0 hours/week (left), the expected foot shape for 15 hours/week (right). The middle picture represents color-mapped Euclidean distance computed between the foot shape obtained for maximum frequency of sport activity and the foot shape obtained for minimum frequency of sport activity
