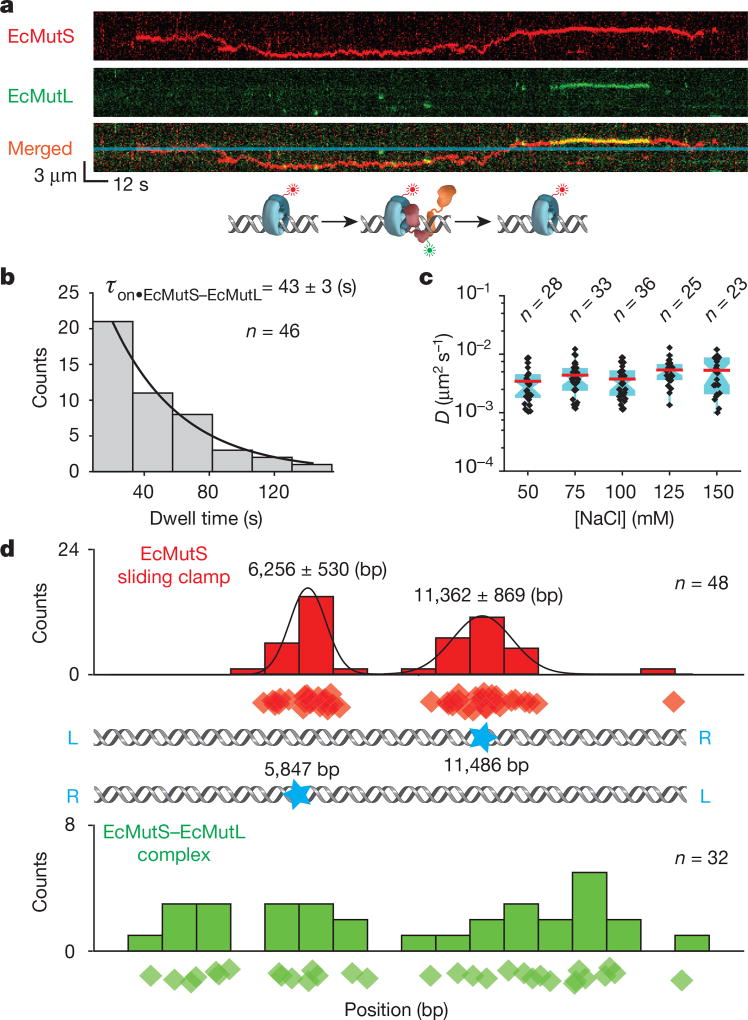
Figure 1. The formation of an EcMutS–EcMutL complex alters the diffusion properties of EcMutS.
a, Representative kymographs and illustration showing an EcMutL loaded by an EcMutS sliding clamp. Blue line indicates the mismatch position. b, The distribution of dwell times for the EcMutS–EcMutL complex (τon•EcMutS–EcMutL; mean ± s.e.m.). c, Box plots of D for the EcMutS–EcMutL complex at different NaCl concentrations (n = number of molecules; Methods). d, The distribution of the starting positions for EcMutS (top) or EcMutS–EcMutL complexes on DNA (bottom). There are two possible orientations of the mismatched DNA with mismatch position (blue star; middle panel). Diamonds in top and bottom panels represent individual starting events. Gaussian fit to the top panel distributions is shown as black lines with the mean ± s.d.

