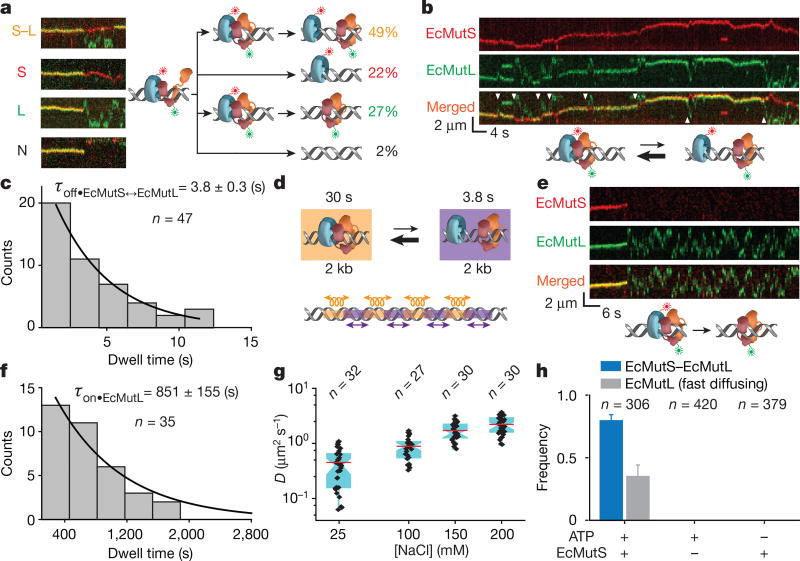
Figure 2. The formation of an oscillating EcMutS–EcMutL complex and fast-diffusing EcMutL.
a, Representative kymographs and illustrations showing the different types of EcMutS–EcMutL complex dissociations (coloured letters). The frequency (%) of each dissociation type is shown (right, coloured numbers). b, Representative kymographs and illustration showing an oscillating EcMutS–EcMutL complex (white arrowheads indicates dissociation events). c, Dissociation time distribution (τoff•EcMutS↔EcMutL; mean ± s.e.m.) for the oscillating EcMutS–EcMutL complex. d, Illustration of oscillating EcMutS–EcMutL complex with lifetimes and calculated diffusion distances. Oscillations are indicated for illustration only and should be stochastic. e, Representative kymographs and illustration showing the dissociation and fast diffusion of EcMutL from an EcMutS–EcMutL complex. f, Dwell time distribution (mean ± s.e.m.) of fast-diffusing EcMutL on the mismatched DNA. g, Box plots of D for fast-diffusing EcMutL at different NaCl concentrations. h, The frequency of EcMutS–EcMutL complex and fast-diffusing EcMutL under various conditions (mean ± s.d.); n = number of DNA molecules.

