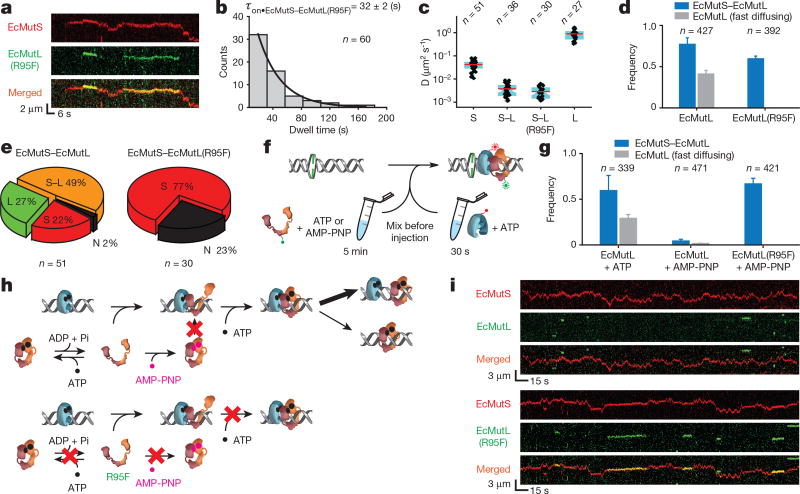
Figure 3. ATP binding by EcMutL results in formation of a ring-like sliding clamp.
a, Representative kymographs showing the formation of two separate EcMutS–EcMutL(R95F) complexes on a mismatched DNA. b, Dwell time distribution for the EcMutS–EcMutL(R95F) complex (τon•EcMutS–EcMutL(R95F); mean ± s.e.m.). c, Box plots of D for the EcMutS sliding clamp (S); EcMutS–EcMutL complex (S–L); EcMutS–EcMutL(R95F) complex (S–L(R95F)); and EcMutL particle (L) at 100 mM NaCl. d, The frequency of EcMutS–EcMutL complex (blue) and fast-diffusing EcMutL (grey) with wild-type EcMutL or EcMutL(R95F) (mean ± s.d.). e, Pie charts showing the distributions of dissociation types for EcMutS–EcMutL or EcMutS–EcMutL(R95F) complexes. Frequency and dissociation types are indicated within the pie chart (see Fig. 2a). f, Illustration of ATP and AMP-PNP pre-incubation studies. g, The frequency of EcMutS–EcMutL complex and fast-diffusing EcMutL under various EcMutL or EcMutL(R95F) pre-incubation conditions (mean ± s.d.). h, Illustration showing AMP-PNP induced EcMutL ring-like clamp closure (top) that does not affect EcMutL(R95F) (bottom). i, Representative kymographs showing the absence of EcMutS–EcMutL complexes and the presence of EcMutS–EcMutL(R95F) complexes following pre-incubation of EcMutL or EcMutL(R95F) with AMP-PNP.

