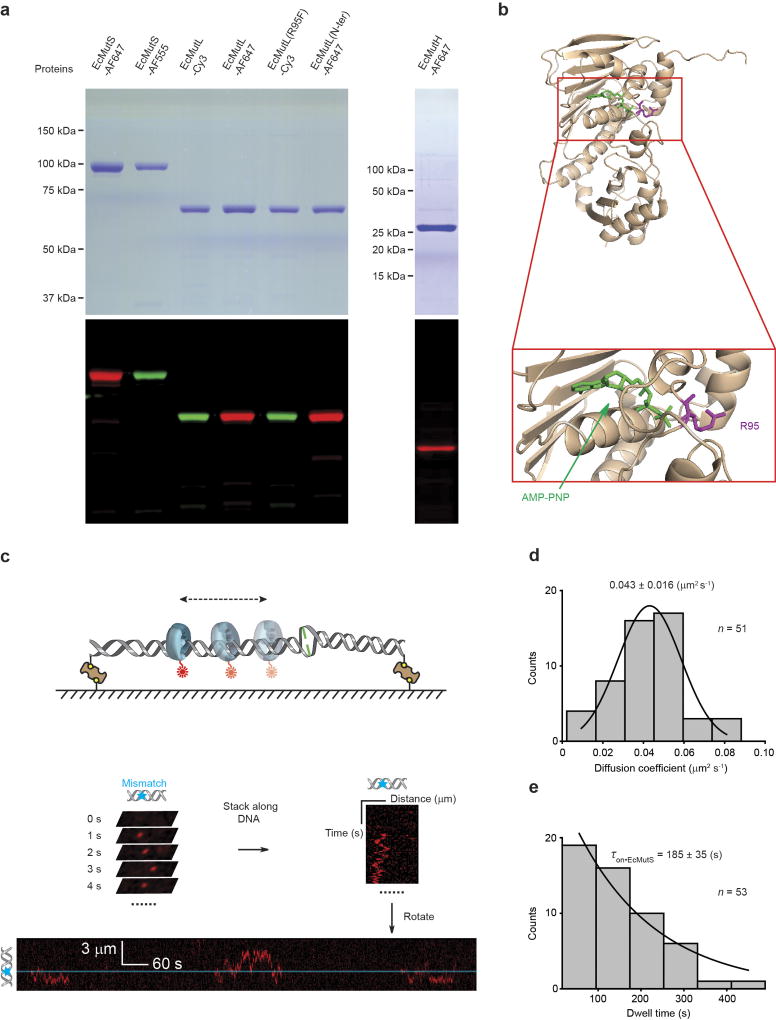
Extended Data Figure 2. The fluorophore-labelled E. coli MMR proteins used in these studies and the formation of an EcMutS sliding clamp on DNA.
a, Coomassie stained (top) and fluorescent (bottom) SDS–PAGE gels of labelled MMR proteins. For gel source data, see Supplementary Fig. 1. b, A crystal structure of the N-terminal domain of EcMutL bound to AMP-PNP (top) and magnification of the binding domain (bottom; PDB ID: 1B63). AMP-PNP is shown in green and Arg-95 (R95) is shown in magenta24. c, An illustration of the kymograph construction of three separate EcMutS sliding clamps on a single mismatched DNA. d, The distribution of diffusion coefficients for the EcMutS sliding clamp. The data were fit to a Gaussian with the mean ± s.d. e, The distribution of dwell times (mean ± s.e.m.) for the EcMutS sliding clamp.

