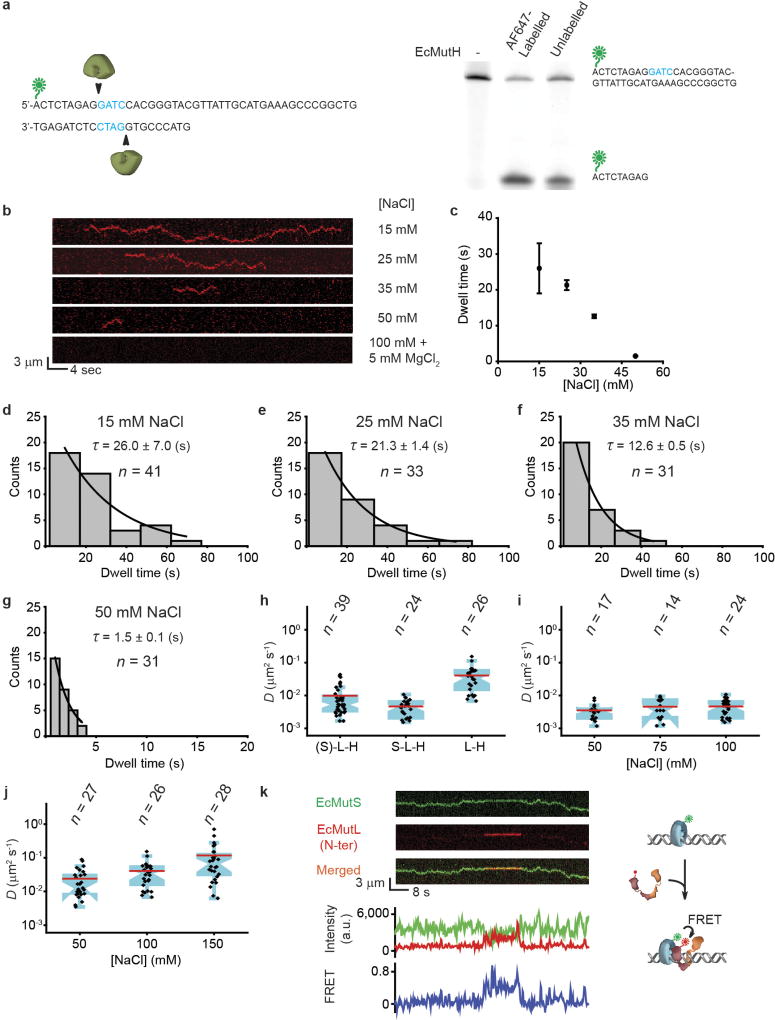
Extended Data Figure 5. EcMutH lifetime on DNA and diffusion coefficient of EcMutS–EcMutL–EcMutH and/or EcMutL–EcMutH complex.
a, A schematic illustration of EcMutH endonuclease assay (left) and a comparison of labelled or unlabelled EcMutH endonuclease activities (right). For gel source data, see Supplementary Fig. 1. b, c, Representative kymographs and dwell times (mean ± s.e.m.) showing EcMutH on a single mismatched DNA under various ionic and magnesium conditions. d–g, The distributions of dwell times (mean ± s.e.m.) for EcMutH on a single mismatched DNA at different biochemical conditions as indicated. h, Box plots showing D for oscillating (EcMutS)–EcMutLCy3–EcMutHAF647 ((S)–L–H) complex; the established EcMutSAF555–EcMutL–EcMutHAF647 complex (S–L–H); and free EcMutLCy3–EcMutHAF647 complex (L–H) at 100 mM NaCl. i, Box plots showing D for established EcMutS–EcMutL–EcMutH complex at different NaCl concentrations. Two-sample t-test showed no significant difference between diffusion coefficients (P > 0.1). j, Box plots showing D for free EcMutL–EcMutH complex at different NaCl concentrations. Two-sample t-test showed significant differences between diffusion coefficients (P < 0.05). k, Top left, representative kymographs showing FRET between C-terminal AF555-labelled EcMutS and N-terminal AF647-labelled EcMutL (N-ter). Bottom, fluorescent intensities of EcMutS–AF555 (donor, green), EcMutL–AF647 (acceptor, red) and FRET (blue) between them when only the green laser was used for illumination. Right, a schematic illustration of kymographs. Experimental FRET measure (EEcMutS–EcMutL = 0.48 ± 0.05; mean ± s.d.) and theoretical FRET (EEcMutS–EcMutL = 0.56) based on crosslink structure22 appeared comparable. n = number of molecules throughout.

