Fig. 1.

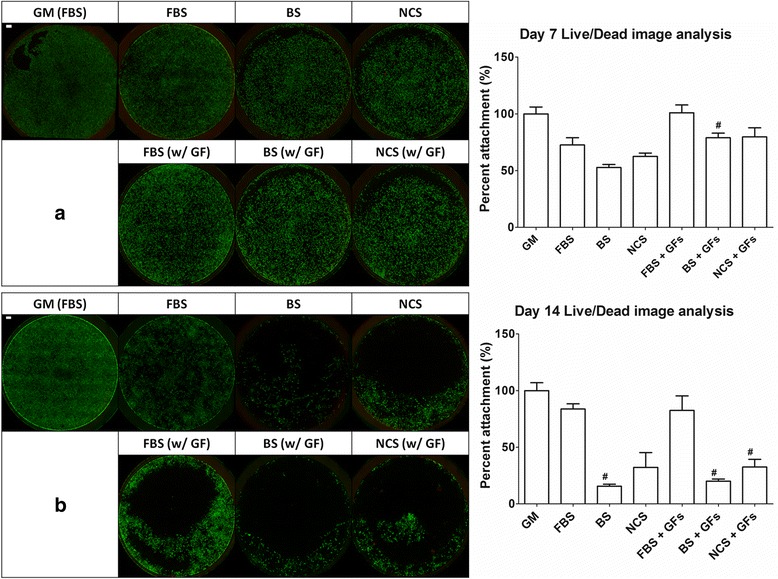
Viability and distribution of ADSCs stained using Live/Dead assay on day 7 (a) and day 14 (b) in different serum and growth factor conditions. Scale bar = 1000 μm

Viability and distribution of ADSCs stained using Live/Dead assay on day 7 (a) and day 14 (b) in different serum and growth factor conditions. Scale bar = 1000 μm