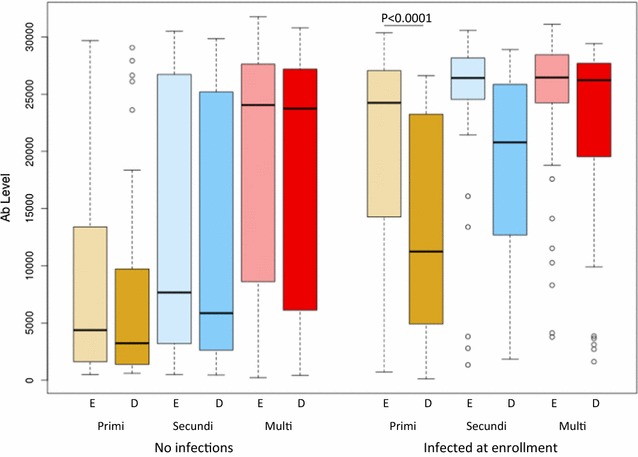
Fig. 3.

Antibody levels to VAR2CSA domains expressed as mean antibody levels to 11 domains at enrollment (E, light shade) and at delivery (D, dark shade) in women with no infections during the study and women infected at enrollment only. Numbers that follow indicate the number of samples with no infection or infection at enrollment only at enrollment (E) and at delivery (D) in each gravid group: primigravidae (E, n = 66, 48; D, n = 64, 46); secundigravidae (E, n = 64, 22; D, n = 57, 23); multigravidae (E, n = 212, 38; D, n = 204, 40). Box plot indicates the median (horizontal line) and interquartile range (box), the whiskers indicate the 10th and 90th percentiles
