
Fig. 1.
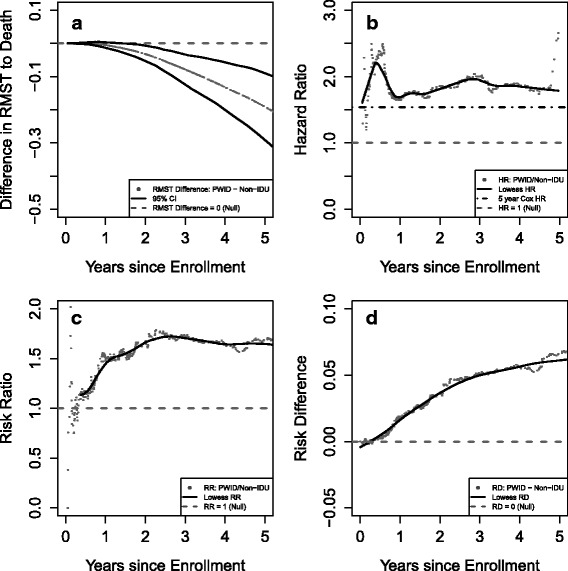
The effect of follow-up time on four different effect estimates comparing all-cause mortality by IDU. Panel a) displays the standardizeda difference (with 95% confidence interval) in restricted mean time to all-cause mortality by history of injection drug use over follow-up time. Panel b) displays the standardizeda all-cause hazard ratio (HR) over follow-up time. Panel c) displays the standardizeda all-cause mortality risk ratio (RR) over follow-up time. Panel d) displays the standardizeda all-cause mortality risk difference (RD) over follow-up time. a Curves are standardized to the distribution of sex, race, AIDS diagnosis, prior ART mono- or dual-therapy, age, CD4 cell count, log10 HIV viral load, Hepatitis C, history of smoking, and hazardous alcohol use in the total sample at clinic enrollment using inverse probability of exposure weights. b Dashed grey lines represent the null hypothesis (i.e. difference in RMST = 0, HR = 1, RR = 1, and RD = 0) in each panel. c The dot-dash black line on panel b is the HR estimated from the Cox Proportional Hazards Model. d The solid black line on panels b, c, and d is the lowess smoother to show the overall trend of the estimands. e The RR and RD is defined as and , respectively, where is the weighted survival curve