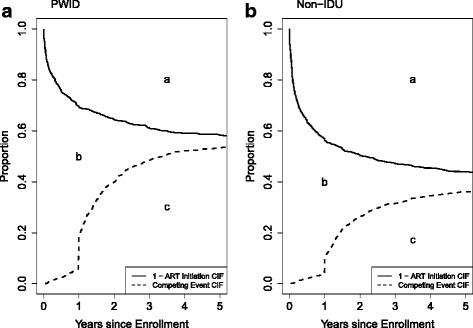
Fig. 2.

Standardizeda cumulative incidence functions (CIF)b for ART initiation and for the composite competing event, death or loss-to-clinic, for PWID (a) and non-IDU (b). a Curves are standardized to the distribution of sex, race, AIDS diagnosis, prior ART mono- or dual-therapy, age, CD4 cell count and log10 HIV RNA level in the total sample at enrollment using inverse probability of exposure weights. bSolid line is the standardized 1-CIF (cumulative incidence function) for ART initiation. Dashed line is the CIF for the composite competing event, death or loss-to-clinic. Area “a” is the 5-year restricted mean time after ART initiation; “b” is the 5-year restricted mean time spent not on ART while alive and in clinic; “c” is the 5-year restricted mean time after death or loss-to-clinic
