Fig. 3.

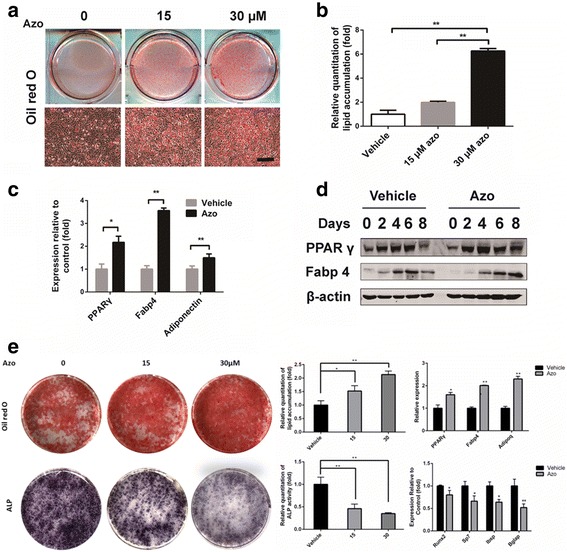
Enhanced adipogenic differentiation potential of C3H10T1/2 cells and mouse-derived MSCs with azoramide treatment in vitro. a, b Oil red O staining for lipid production and its quantification with different concentrations of azoramide (Azo). Scale bar = 100 μm. c Real-time qPCR of peroxisome proliferator-activated receptor gamma (PPARγ), fatty acid binding protein 4 (Fabp4), and adiponectin (Adipoq) mRNA in C3H10T1/2 cells subjected to 15 μM azoramide. d Western blot of PPARγ and Fabp4 proteins in C3H10T1/2 cells subjected to 15 μM azoramide. e Oil red O staining for lipid production and alkaline phosphatase (ALP) staining for osteogenesis in mouse-derived MSCs subjected to different concentrations of azoramide and quantifications. Scale bar = 100 μm. *p < 0.05, **p < 0.01, azoramide versus vehicle. Bglap bone gamma-carboxyglutamate protein, Ibsp integrin binding sialoprotein, Runx2 Runt-related transcription factor 2
