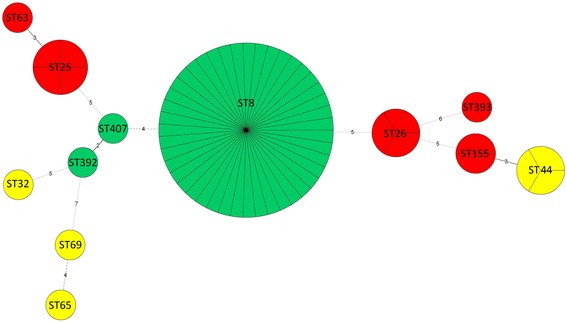
Fig. 2.

Minimum spanning tree of the MLSTs of the 62 C. diphtheriae isolates. Each circle corresponds to an ST. The area of each circle corresponds to the number of isolates. Each ST is colour coded according to its corresponding time period of isolation: red – 1950s-1960s, yellow – 1990s-2001, green – 2004-2016. The relationships between the isolates are indicated by the connections between the isolates and the lengths of the branches linking them. The numbers between the circles indicate the number of allelic differences
