Fig. 3.

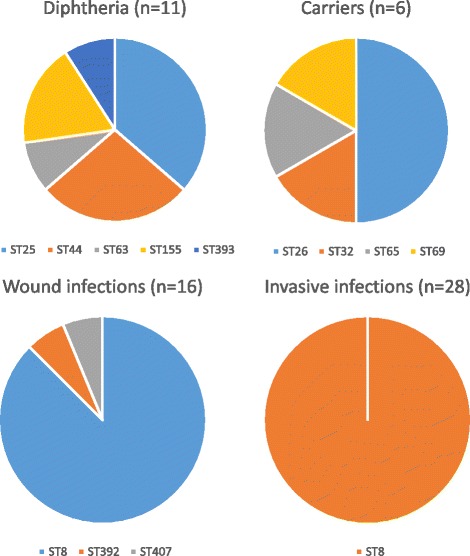
Distribution of STs by type of infections (n – number of isolates included in the study). The charts do not include isolate 72/E (site of isolation is not known)

Distribution of STs by type of infections (n – number of isolates included in the study). The charts do not include isolate 72/E (site of isolation is not known)