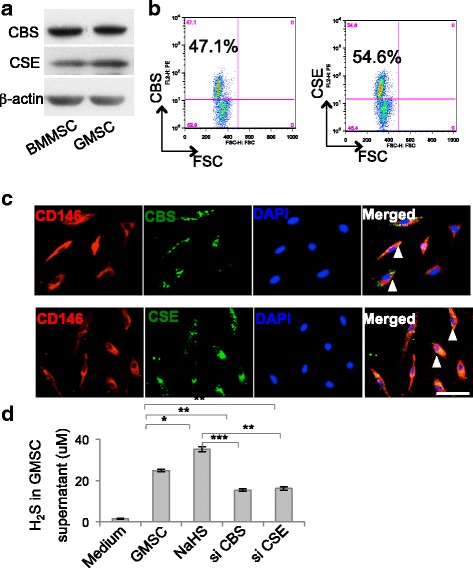
Fig. 1.

GMSCs produced H2S. a GMSCs expressed CBS and CSE, as assessed by western blot analysis. b Flow cytometry analysis showed 47.1% and 54.6% of GMSCs positive for CBS and CSE, respectively. c GMSCs positive for both CD146 and CBS or CSE, as assessed by immunofluorescence staining. d H2S donor NaHS treatment elevated H2S production in culture supernatant, while CBS siRNA or CSE siRNA treatment downregulated H2S concentrations (n = 5). *P < 0.05, **P < 0.01, ***P < 0.001. Scale bar: 20 μm. Error bars: mean ± SD. All experimental data verified in at least three independent experiments. CBS cystathionine β-synthase, CSE cystathionine γ-lyase, GMSC gingiva-derived mesenchymal stem cell, BMMSC bone marrow mesenchymal stem cell, FSC forward scatter, DAPI 4′6-diamidino-2-phenylindole, H2S hydrogen sulfide, si small interfering
