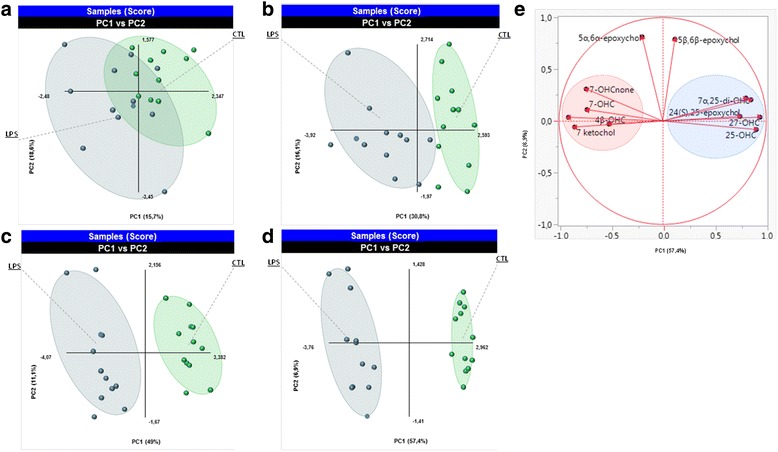
Fig. 2.

Multivariate analysis on all data in oxysterol levels variation in BV2 cells. The result of the partial least-squares discriminant analysis (PLS-DA). The score plot obtained at each time point of the kinetic a 4 h, b 8 h, c 16 h, and d 24 h are shown. Each dot on the graph represents a dish of cells. The quality of the model was assessed by the values of R2 and Q2. These values were 0.36 and 0.73, respectively, after 4 h; 0.76 and 0.63 after 8 h; 0.96 and 0.89 after 16 h; and 0.98 and 0.96 after 24 h. e The loading plot of different oxysterols at the 24 h time point
