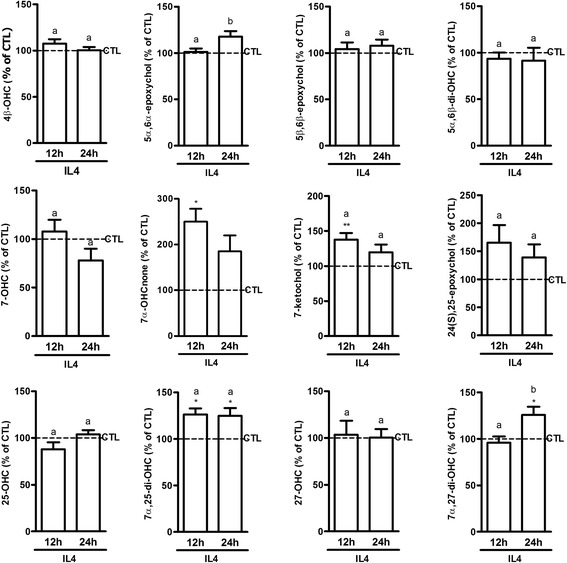
Fig. 4.

Oxysterol levels in IL-4-activated BV2 cells in comparison to control cells. 107 cells were incubated in media with 1% FBS and containing 10 U/mL of interleukin 4 (IL-4) or vehicle (CTL). Oxysterol levels were analyzed at two time points: 12 and 24 h. The data are expressed as the mean ± SEM in percentage of their respective controls (CTL). **p < 0.01 and *p < 0.05 for LPS-activated cells versus their respective controls. The different letters (a, b) indicate differences between the time points
