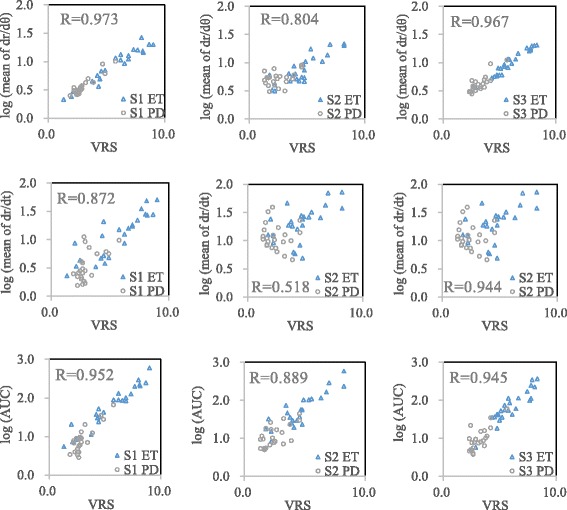
Fig. 3.

Linear regression analysis of the logarithm values of the three investigated parameters and VRS scores in the three test conditions. Data from 24 patients (testing group) were included in each figure, and each patient had two data points (two hands). The parameters log(|dr/dθ|) and log(AUC) correlated well with the VRS scores (R > 0.7) regardless of the test conditions, and all correlations were statistically significant (p < 0.01) (the units of |dr/dt|: mm/s; |dr/dθ|: mm/rad; AUC: mm × Hz/s)
