Fig. 5.

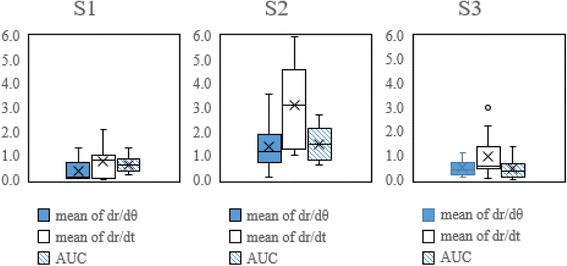
The box chart of the VRSd-system from three parameters of three tests. The variance of S1 and S3 test are much smaller than S2, indicating that S2 has the much larger individual difference of group

The box chart of the VRSd-system from three parameters of three tests. The variance of S1 and S3 test are much smaller than S2, indicating that S2 has the much larger individual difference of group