
Fig. 1.
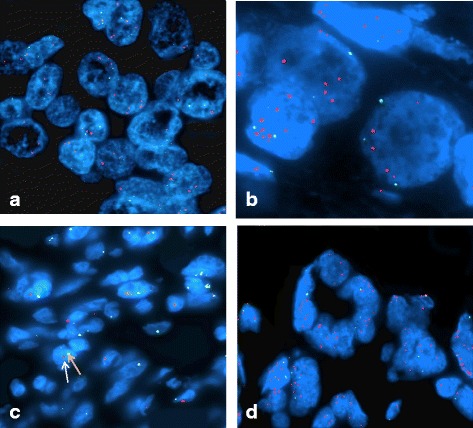
FISH hybridization of MYC in breast tumor tissues. The FISH probe for MYC is labeled with a red fluorochrome, and the normal control signal for the chromosome 8 centromere is labeled in green. The nuclei of the cells are visualized via DAPI counterstaining. a 1:3 ratio of MYC to centromere signals indicating low amplification is shown. b 1:5 ration of MYC to centromere signals indicating moderate amplification is shown. c 1:1 copy ratio of MYC to centromere signals indicating no amplification of the MYC gene is shown. d 1: 8 copy ratio of MYC to centromere signals indicating high amplification is shown in the panel