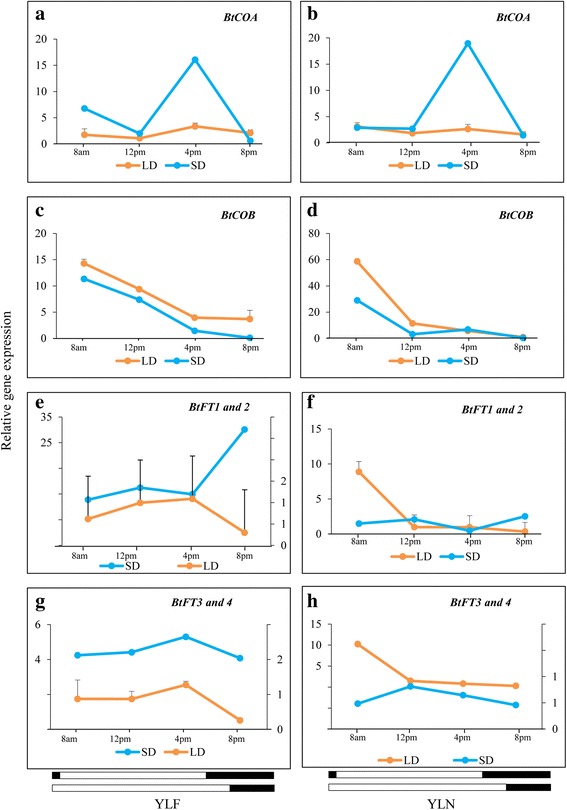
Fig. 8.

Comparison of diurnal expressions of BtCO and BtFT homologs in YLF and YLN during SD and LD. a, b BtCOA, c, d BtCOB, e, f BtFT1, 2 and g, h BtFT3, 4. Transcript expression of eIF4α was used to normalize expression data of the targeted flowering genes in different tissues. The relative fold change was calculated by 2-∆∆CT method using the expression data in rhizome as calibrator and is plotted using two Y axis. Each data point in the line graph represents mean of three biological replicates ± SE in case of LD and one biological replicate in case of SD
