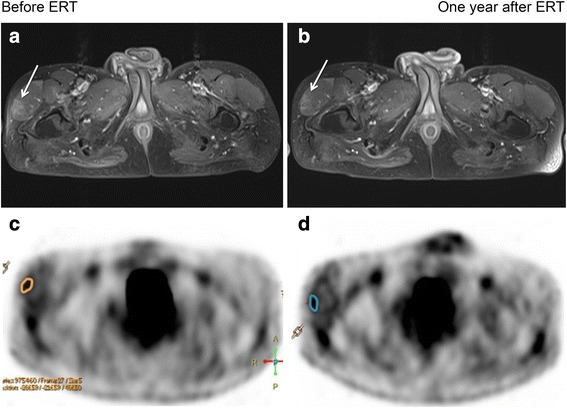
Fig. 5.

MRI (a, b) and FDG PET (c, d) before and after 1 year of ERT. MRI shows slight improvement, i.e., less hyperintensity of the tensor fasciae latae muscle (arrow) in the T1w sequence after gadolinium administration 1 year after ERT. FDG-PET show no significantly different tracer uptake in the region of interest (orange and blue lines) pre- and post-therapy
