
FIGURE 2.
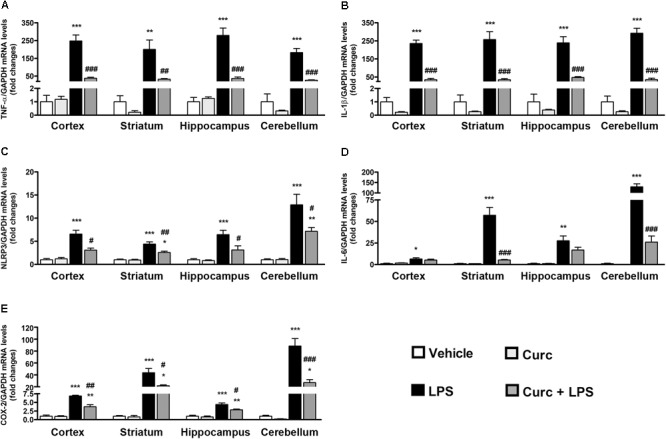
Curcumin inhibits the acute brain pro-inflammatory response to peripheral LPS administration. Mice treated for 2 consecutive days with curcumin (curc; 50 mg/kg) received a single i.p. injection of LPS (5 mg/kg). Two hours following LPS or saline injection, mice were sacrificed and cerebral cortex, striatum, hippocampus, and cerebellum were extracted and prepared as described in Section “Materials and Methods.” (A) Analysis of TNF-α mRNA expression levels was conducted via real-time PCR. Results are expressed as fold-increase with respect to control (vehicle only). Data are means ± SEM (n = 4 mice/group). Data were analyzed by one-way ANOVA [F(15,48) = 32.89, p < 0.0001] followed by Bonferroni’s multiple comparison test. ∗∗∗p < 0.001 vs. control group; ##p < 0.01 and ###p < 0.001 vs. LPS-stimulated group. (B) Analysis of IL-1β mRNA expression levels was conducted via real-time PCR. Results are expressed as fold-increase with respect to control (vehicle only). Data are means ± SEM (n = 4 mice/group). Data were analyzed by one-way ANOVA [F(15,48) = 59.32, p < 0.0001] followed by Bonferroni’s multiple comparison test. ∗∗∗p < 0.001 vs. control group; ###p < 0.001 vs. LPS-stimulated group. (C) Analysis of NLRP3 mRNA expression levels was conducted via real-time PCR. Results are expressed as fold-increase with respect to control (vehicle only). Data are means ± SEM (n = at least 4 mice/group). Data were analyzed by one-way ANOVA [F(15,54) = 26.21, p < 0.0001] followed by Bonferroni’s multiple comparison test. ∗∗∗p < 0.001 vs. control group; #p < 0.05 and ##p < 0.01 vs. LPS-stimulated group. (D) Analysis of IL-6 mRNA expression levels was conducted via real-time PCR. Results are expressed as fold-increase with respect to control (vehicle only). Data are means ± SEM (n = 4 mice/group). Data were analyzed by one-way ANOVA [F(15,48) = 49.62, p < 0.0001] followed by Bonferroni’s multiple comparison test. ∗p < 0.05, ∗∗p < 0.01 and ∗∗∗p < 0.001 vs. control group; ###p < 0.001 vs. LPS-stimulated group. (E) Analysis of COX-2 mRNA expression levels was conducted via real-time PCR. Results are expressed as fold-increase with respect to control (vehicle only). Data are means ± SEM (n = 4 mice/group). Data were analyzed by one-way ANOVA [F(15,48) = 45.03, p < 0.0001] followed by Bonferroni’s multiple comparison test. ∗∗p < 0.01 and ∗∗∗p < 0.001 vs. control group; #p < 0.05 and ##p < 0.01 and ###p < 0.001 vs. LPS-stimulated group.