
FIGURE 4.
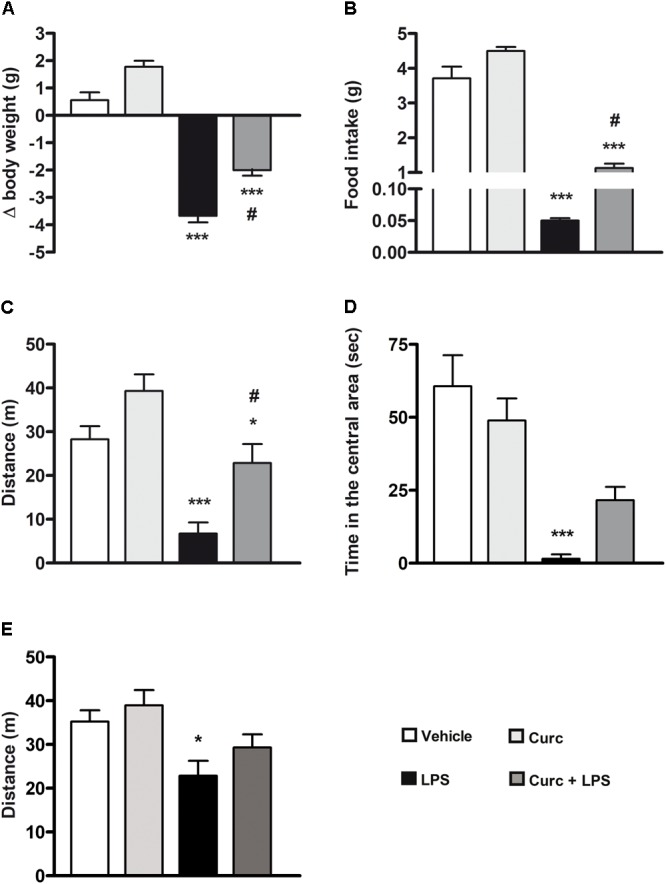
Curcumin attenuates the acute symptoms of sickness behavior caused by peripheral LPS administration. Mice treated for 2 consecutive days with curcumin (curc; 50 mg/kg) received a single i.p. injection of LPS (5 mg/kg). (A) Twenty-four hours following LPS or saline injection, body weight was measured as described in Section “Materials and Methods.” Data are means ± SEM (n = at least 7 mice/group). Data were analyzed by one-way ANOVA [F(3,28) = 97.03, p < 0.0001] followed by Bonferroni’s multiple comparison test. ∗∗∗p < 0.001 vs. control group; #p < 0.05 vs. LPS-stimulated group. (B) Twenty-four hours following LPS or saline injection, the amount of food intake was measured as described in Section “Materials and Methods.” Data are means ± SEM (n = 7 mice/group). Data were analyzed by one-way ANOVA [F(3,24) = 136.30, p < 0.0001] followed by Bonferroni’s multiple comparison test. ∗∗∗p < 0.001 vs. control group; #p < 0.05 vs. LPS-stimulated group. (C) Twenty-four hours following LPS or saline injection, total distance traveled was measured as described in Section “Materials and Methods.” Data are means ± SEM (n = at least 7 mice/group). Data were analyzed by one-way ANOVA [F(3,34) = 10.98, p < 0.0001] followed by Bonferroni’s multiple comparison test. ∗p < 0.05 and ∗∗∗p < 0.001 vs. control group; #p < 0.05 vs. LPS-stimulated group. (D) Twenty-four hours following LPS or saline injection, amount of time spent in the central area of the open field arena was measured as described in Section “Materials and Methods.” Data are means ± SEM (n = 7 mice/group). Data were analyzed by one-way ANOVA [F(3,24) = 24.58, p < 0.0001] followed by Bonferroni’s multiple comparison test. ∗∗∗p < 0.001 vs. control group. (E) Seven days after LPS treatment, total distance traveled was also measured. Data are means ± SEM (n = at least 7 mice/group). Data were analyzed by one-way ANOVA [F(4,43) = 4.33, p = 0.0094] followed by Bonferroni’s multiple comparison test. ∗p < 0.05 vs. control group.