
Fig. 1.
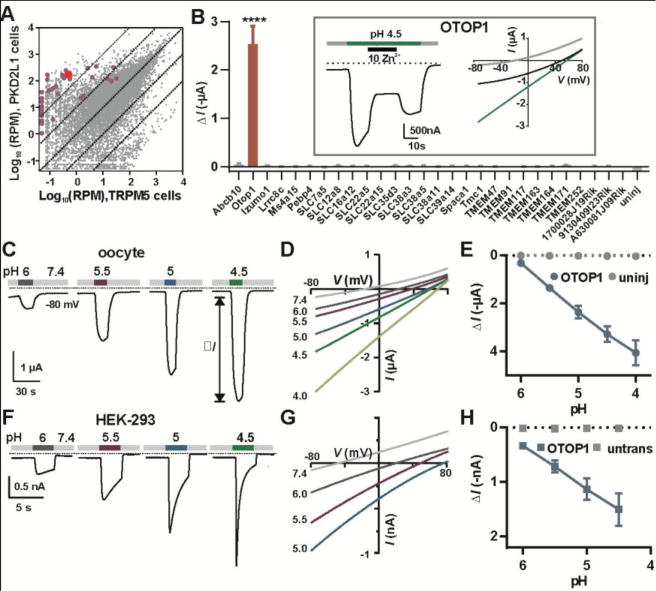
Expression analysis of taste-cell enriched genes identifies OTOP1 as a novel proton channel. (A) Transcriptome profiling of PKD2L1 and TRPM5 taste receptor cells (Each data point represents the average of 5 replicates). Genes tested by electrophysiology are highlighted in magenta or red (OTOP1). RPM, reads per million. (B) Magnitude of currents evoked in response to pH 4.5 Na+-free solution in Xenopus oocytes expressing the genes indicated (Vm = −80mV; data are mean ± SEM, n = 3 – 37; for OTOP1, n = 5). ****, P < 0.0001 compared to uninjected oocytes (n = 3). One-way ANOVA with Bonferroni correction. Inset: currents evoked in an OTOP1-expressing oocyte to the acid stimulus at Vm = −80mV (left) and the current-voltage relationship before (gray), during acid application (green) and during Zn2+ application (black). (C) Current measured by two-electrode voltage clamp in a Xenopus oocyte expressing OTOP1 in response to Na+-free extracellular solutions with pHo as indicated (Vm = −80 mV). (D) I-V relation of the current in (A) from voltage ramps (1V/s). (E) Evoked current (ΔI; mean ± SEM) as a function of pH in Xenopus oocytes expressing OTOP1 (blue circle; n = 4) and uninjected oocytes (grey circles; n = 4). (F) Currents measured by whole-cell patch clamp recording in a HEK-293 cell expressing OTOP1 in Na+-free extracellular solutions (pHi = 7.3, Vm = −80 mV). (G) I-V relation of currents in OTOP1-expressing HEK-293 cell from experiments as in (G) with voltage ramps (1V/s). (H) Evoked currents (ΔI; mean ± SEM) as a function of pH in HEK-293 cells expressing OTOP1 (blue squares; n = 5) and untransfected cells (grey squares; n = 3).