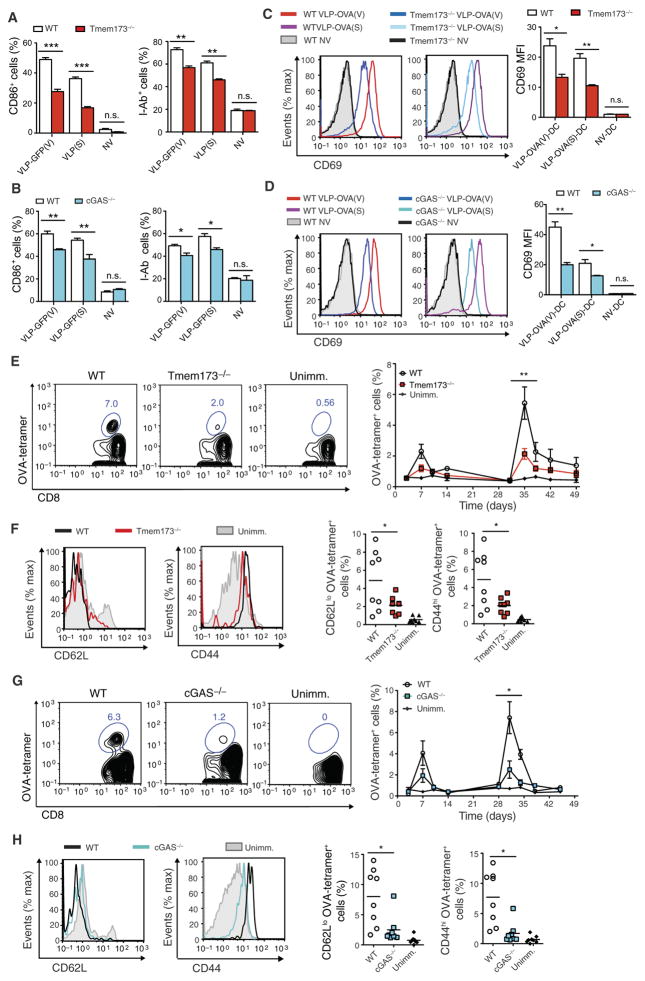
Fig. 5. VLPs activate DCs and antigen-specific CD8+ T cells via the STING and cGAS pathway.
(A and B) BMDCs from Tmem173−/− and cGAS−/− mice were treated with VLP-GFP(V) or VLP-GFP(S) and analyzed at 24 hours for CD86 and I-Ab expression by flow cytometry. (C and D) Tmem173−/− and cGAS−/− BMDCs were treated with VLP-OVA pseudotyped with VSV-G [VLP-OVA(V)] or SVGmu [VLP-OVA(S)] and then cocultured with OT-1 CD8+ T cells for 24 hours. Representative FACS plots show expression of the T cell activation marker CD69 among the OT-1 CD8+ T cells (C and D) (left). Graph depicts CD69 MFI of the OT-1 CD8+ T cells (C and D) (right). (E to H) Tmem173−/−, cGAS−/−, and wild-type mice were homologously prime-boosted with SVGmu-pseudotyped VLP-OVA (n = 8 per group). OVA-tetramer+ cells gated on CD8+ T cells from the blood were demonstrated on representative FACS plot at 10 days after primary immunization (E and G) (left) or measured over time (E and G) (right) (black arrow, boost). Statistical comparisons were made between the OVA-tetramer+ CD8+ T cell response of the VLP-immunized wild-type and VLP-immunized mutant mice. CD62Llo and CD44hi OVA-tetramer+ CD8+ T cells from LV- immunized Tmem173−/−, cGAS−/−, and wild-type mice were compared with naïve CD8+ T cells from unimmunized wild-type mice at 10 days on representative FACS plots (F and H) (left) or by group with each symbol representing an individual mouse and horizontal bar indicating the mean (F and H) (right). Data are representative of two independent experiments (A to H). Results are shown as mean ± SEM (A to E and G). P > 0.05; *P < 0.05; **P < 0.005; ***P < 0.001 (unpaired Student’s t test).

