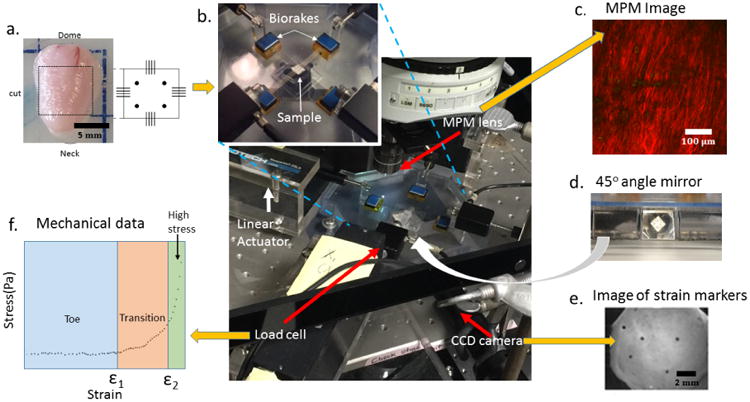
Fig. 2.

Schematic of experimental system developed for mechanical testing and bioimaging of bladder samples. Yellow arrows indicate input (one) and output (three) for the system. (a) Bladder and schematic of of square tissue sample (input), (b) Biaxial testing system under MPM lens with insert showing magnification of tissue loaded on biorakes, (c) Representative projected stack of images showing second harmonic generation signal from MPM imaging (output), (d) Image from 45° mirror showing underside of loaded sample, (e) Image from CCD camera showing strain markers imaged using mirror system (output), (f) Representative loading stress strain curve showing toe, transition and high stress regimes of curve obtained using mechanical testing system (output).
