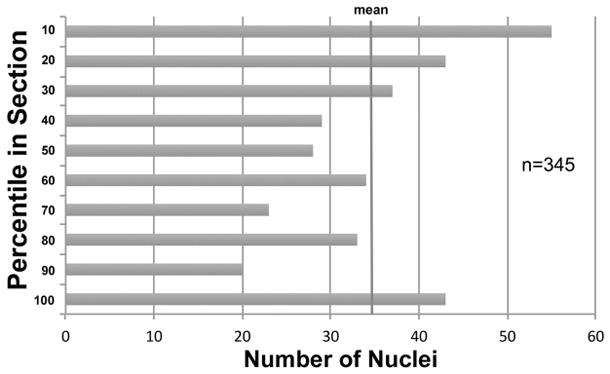
Fig. 1.

Distribution of nuclei in the z-axis of tissue sections. The center of the nucleus of 345 cells was measured in 18 sections, and their distribution was plotted for 10-percentile bins, with the “10” percentile bin being the top of the tissue section (against the cover glass), and the bottom (“100”) percentile bin adjacent to the glass slide. There was no loss of caps at the tissue margins, but rather an increased density of nuclei, indicating differential compression. The measurements for human tissue sections (mean final thickness of 31.4 μm) of the spinal cord are shown, and the z-axis analysis was similar for monkey sections. Accordingly, no guard zones were used, since they would have caused an underestimate due to predominant sampling in the low-density core of the tissue section.
