
Fig. 5.
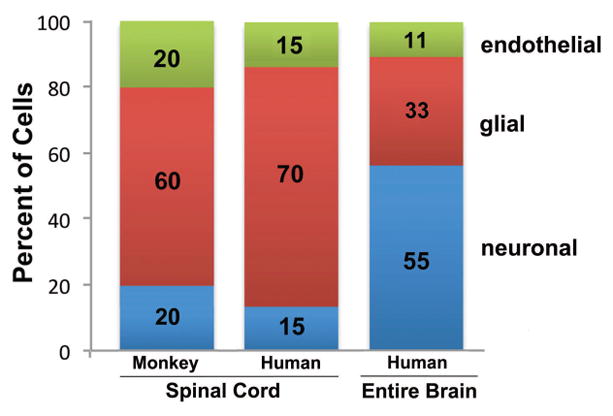
Cellular composition of the spinal cord in cynomolgus monkey and human compared with the composition in an entire human brain, showing the relative percentage of neurons (blue), glial cells (red) and endothelial cells (green), based on the data obtained in the current study. Approximate percentages are indicated on the columns. The bar for the entire human brain adds to 99%, not 100%, due to rounding. The cellular composition in the spinal cord differed considerably from that in the entire brain, and was most similar to the composition found in the brainstem (“rest of brain”) (compare Fig. 5 with Fig. 2).