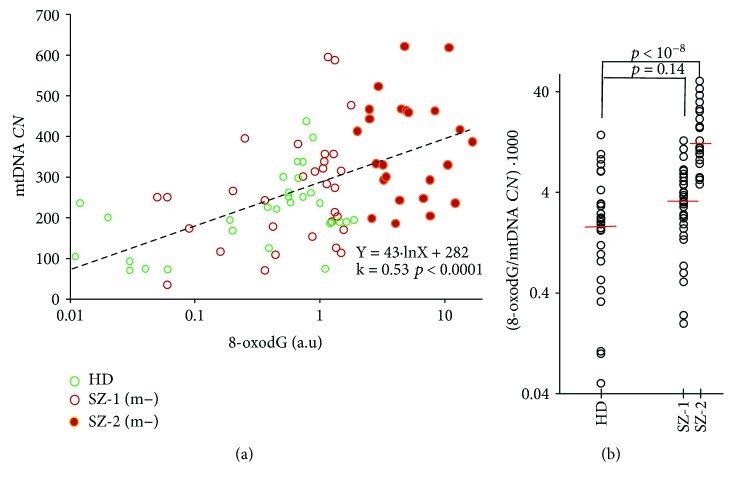
Figure 3.
(a) The dependence of mtDNA CN on 8-oxodG (logarithmic scale) for unmedicated SZ (m−) and control groups. The SZ (m−) group was divided into two subgroups (SZ-1 and SZ-2). SZ-1 contains patients with normal content of 8-oxodG. Healthy donors belong to the same category. SZ-2 contains patients with high level of 8-oxodG. The graph shows the trend line and the linear regression equation. (b) Ratio 8-oxodG/mtDNA CN (logarithmic scale) is defined for three groups. Short lines denote medians. The comparison ratio 8-oxodG/mtDNA CN in the groups by the U-test is given.

