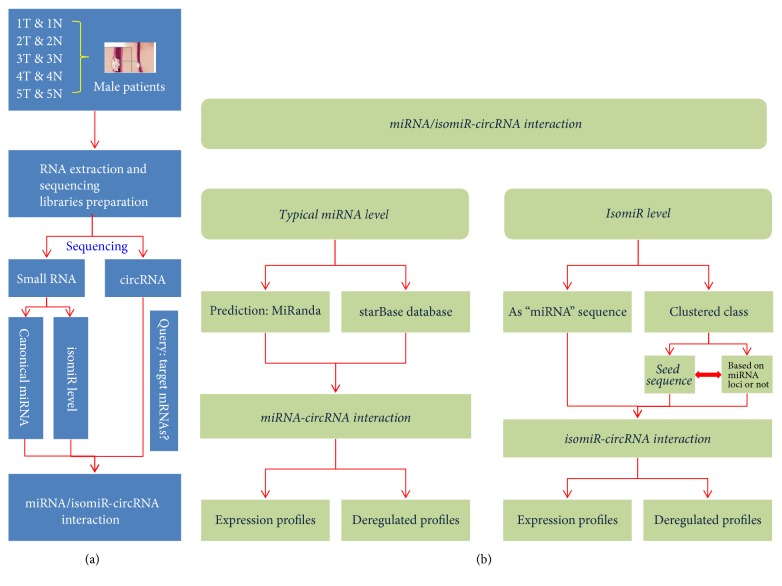
Figure 1.
Flowchart for miRNA/isomiR-circRNA interaction. (a) Flowchart. Cancer and adjacent-normal samples were obtained from 5 male patients, and small RNA expression profiles and circRNA expression profiles were obtained via sequencing. (b) The detailed integrative analysis of small RNAs and circRNAs from the miRNA and isomiR levels.

